Tuesday, August 17, 2021

TEVA stock: 5 Warren Buffett Stocks To Buy For Under $25

 Wayne Duggan

·3 min read

Berkshire Hathaway Inc. (NYSE: BRK-A) (NYSE: BRK-B) CEO Warren Buffett is one of the world’s richest people, with a net worth of around $86 billion. Unfortunately for small retail investors who want to follow in Buffett’s footsteps, buying even one share of Berkshire Hathaway is rather pricey.

Berkshire’s Class-A shares trade at around $345,000 per share. The Class-B shares meant for retail investors aren’t necessarily cheap, trading at around $230.

But just because Buffett’s company itself has a pricey stock doesn’t mean there aren’t Buffett stocks to buy out there that are affordable. Here are five stocks that Berkshire Hathaway holds that are priced under $25 per share.

Related Link: How Bank Of America Has Become One Of Warren Buffett's Best Investments

Sirius XM Holdings Inc (NASDAQ: SIRI)
Sirius is a satellite radio operator and owner of more than 140 channels of content. The company is also the owner of Pandora Media following a $3 billion 2019 buyout.

Berkshire holds 50 million shares of Sirius XM worth around $320.5 million, and the stock is priced at just $6.41 per share.

Teva Pharmaceutical Industries Ltd (NYSE: TEVA)
Teva is the largest generic drugmaker in the world. Buffett recently added five new health care stocks in the third quarter, but he has had his stake in Teva since 2018.

Teva is a classic Buffett value stock, trading at just 3.5 times forward earnings. Buffett holds 42.7 million shares of Teva worth about $400 million, and each share costs just $9.35.

Liberty Latin America Ltd (NASDAQ: LILA) (NASDAQ: LILAK)
Liberty Latin America is a member of the Liberty Media Group that was spun-off from its parent company in 2018. Liberty Latin America is a telecommunications company that serves more than 6 million homes in Latin America and the Caribbean.

The company has two share classes, and Buffett owns a combined 4.6 million shares worth $48.1 million. The good news is that both share classes trade at around $11.90 per share.

Suncor Energy Inc. (NYSE: SU)
It’s been a brutal year for the oil and gas industry, and Canadian oil exploration and production company Suncor Energy is no exception. Shares are down 53.5% year-to-date in 2020, but Buffett isn’t bailing. Buffett famously urged investors to be greedy when others are fearful, and there is plenty of fear in the energy sector these days.

Berkshire holds 19.2 million shares of Suncor worth about $296.4 million. The stock is priced at just $15.44 per share.

Barrick Gold Corp (NYSE: GOLD)
Buffett has historically been very skeptical of gold as an investment, which is why many followers were surprised when Berkshire disclosed a large holding in gold miner Barrick Gold earlier this year. Buffett may be anticipating a spike in gold prices following the U.S. government’s unprecedented economic stimulus actions this year.

Berkshire holds 12 million shares of Barrick worth $290.1 million. The stock trades at just $24.50 per share.

Illustration by Joel Stralnic.

CVX stock: Exxon faces $48B shortfall through 2021 - Reuters | Sept. 8, 2020


Exxon faces $48B shortfall through 2021 - Reuters

  • Exxon Mobil (XOM, -3%) is staring at a huge cash crunch as bets on rising demand sour, which will force the company to cut jobs and may put its dividend in jeopardy, according to a study by Reuters.
  • With global demand for oil hit hard, Exxon's plans for aggressive expansion and to become a top player in shale and LNG are in question.
  • The company is looking at a shortfall of $48B through the end of next year, according to a Reuters analysis using cash from operations, commitments to shareholder payouts and costs for the expansion program.
  • About 10% of its workforce will face "harsh reviews" and Exxon is looking at cutting its enviable retirement benefits.
  • There could also be pressure to cut Exxon's dividend, although CEO Darren Woods said in July it was sacrosanct. Exxon's current annual payout is $3.48, with a yield of 8.9%.
  • The stock is down 44% year to date. It was booted out of the Dow Jones Industrial Average last month after 92 years in the blue-chip index.
  • Take a deeper look at Exxon's quarterly cash flow.

CVX stock: Is Chevron (CVX) Outperforming Other Oils-Energy Stocks This Year?

Tue., August 17, 2021, 8:30 a.m. 

Investors interested in Oils-Energy stocks should always be looking to find the best-performing companies in the group. Is Chevron (CVX) one of those stocks right now? By taking a look at the stock's year-to-date performance in comparison to its Oils-Energy peers, we might be able to answer that question.

Chevron is one of 252 individual stocks in the Oils-Energy sector. Collectively, these companies sit at #9 in the Zacks Sector Rank. The Zacks Sector Rank includes 16 different groups and is listed in order from best to worst in terms of the average Zacks Rank of the individual companies within each of these sectors.

The Zacks Rank emphasizes earnings estimates and estimate revisions to find stocks with improving earnings outlooks. This system has a long record of success, and these stocks tend to be on track to beat the market over the next one to three months. CVX is currently sporting a Zacks Rank of #1 (Strong Buy).

The Zacks Consensus Estimate for CVX's full-year earnings has moved 21.88% higher within the past quarter. This is a sign of improving analyst sentiment and a positive earnings outlook trend.

Our latest available data shows that CVX has returned about 19.50% since the start of the calendar year. In comparison, Oils-Energy companies have returned an average of 19.06%. This shows that Chevron is outperforming its peers so far this year.

Looking more specifically, CVX belongs to the Oil and Gas - Integrated - International industry, a group that includes 16 individual stocks and currently sits at #31 in the Zacks Industry Rank. On average, stocks in this group have gained 27.23% this year, meaning that CVX is slightly underperforming its industry in terms of year-to-date returns.

CVX will likely be looking to continue its solid performance, so investors interested in Oils-Energy stocks should continue to pay close attention to the company.

SABR stock: Undervalue 40%? | August 17, 2021

 Aug. 17, 2021

Here is the article. 

·6 min read

Does the August share price for Sabre Corporation (NASDAQ:SABR) reflect what it's really worth? Today, we will estimate the stock's intrinsic value by taking the expected future cash flows and discounting them to their present value. We will take advantage of the Discounted Cash Flow (DCF) model for this purpose. Models like these may appear beyond the comprehension of a lay person, but they're fairly easy to follow.

Companies can be valued in a lot of ways, so we would point out that a DCF is not perfect for every situation. For those who are keen learners of equity analysis, the Simply Wall St analysis model here may be something of interest to you.

Crunching the numbers

We're using the 2-stage growth model, which simply means we take in account two stages of company's growth. In the initial period the company may have a higher growth rate and the second stage is usually assumed to have a stable growth rate. To start off with, we need to estimate the next ten years of cash flows. Where possible we use analyst estimates, but when these aren't available we extrapolate the previous free cash flow (FCF) from the last estimate or reported value. We assume companies with shrinking free cash flow will slow their rate of shrinkage, and that companies with growing free cash flow will see their growth rate slow, over this period. We do this to reflect that growth tends to slow more in the early years than it does in later years.

A DCF is all about the idea that a dollar in the future is less valuable than a dollar today, so we need to discount the sum of these future cash flows to arrive at a present value estimate:

10-year free cash flow (FCF) estimate

2022

2023

2024

2025

2026

2027

2028

2029

2030

2031

Levered FCF ($, Millions)

US$64.0m

US$300.5m

US$476.5m

US$543.0m

US$591.9m

US$632.7m

US$667.1m

US$696.4m

US$722.0m

US$744.8m

Growth Rate Estimate Source

Analyst x2

Analyst x2

Analyst x2

Analyst x1

Est @ 9%

Est @ 6.9%

Est @ 5.43%

Est @ 4.4%

Est @ 3.67%

Est @ 3.17%

Present Value ($, Millions) Discounted @ 11%

US$57.7

US$244

US$349

US$358

US$351

US$339

US$322

US$302

US$283

US$263

("Est" = FCF growth rate estimated by Simply Wall St)

We now need to calculate the Terminal Value, which accounts for all the future cash flows after this ten year period. For a number of reasons a very conservative growth rate is used that cannot exceed that of a country's GDP growth. In this case we have used the 5-year average of the 10-year government bond yield (2.0%) to estimate future growth. In the same way as with the 10-year 'growth' period, we discount future cash flows to today's value, using a cost of equity of 11%.

Terminal Value (TV)= FCF2031 × (1 + g) ÷ (r – g) = US$745m× (1 + 2.0%) ÷ (11%– 2.0%) = US$8.4b

Present Value of Terminal Value (PVTV)= TV / (1 + r)10= US$8.4b÷ ( 1 + 11%)10= US$3.0b

The total value is the sum of cash flows for the next ten years plus the discounted terminal value, which results in the Total Equity Value, which in this case is US$5.8b. The last step is to then divide the equity value by the number of shares outstanding. Relative to the current share price of US$10.9, the company appears quite good value at a 40% discount to where the stock price trades currently. The assumptions in any calculation have a big impact on the valuation, so it is better to view this as a rough estimate, not precise down to the last cent.

Important assumptions

We would point out that the most important inputs to a discounted cash flow are the discount rate and of course the actual cash flows. Part of investing is coming up with your own evaluation of a company's future performance, so try the calculation yourself and check your own assumptions. The DCF also does not consider the possible cyclicality of an industry, or a company's future capital requirements, so it does not give a full picture of a company's potential performance. Given that we are looking at Sabre as potential shareholders, the cost of equity is used as the discount rate, rather than the cost of capital (or weighted average cost of capital, WACC) which accounts for debt. In this calculation we've used 11%, which is based on a levered beta of 1.906. Beta is a measure of a stock's volatility, compared to the market as a whole. We get our beta from the industry average beta of globally comparable companies, with an imposed limit between 0.8 and 2.0, which is a reasonable range for a stable business.

Looking Ahead:

Although the valuation of a company is important, it ideally won't be the sole piece of analysis you scrutinize for a company. The DCF model is not a perfect stock valuation tool. Rather it should be seen as a guide to "what assumptions need to be true for this stock to be under/overvalued?" For example, changes in the company's cost of equity or the risk free rate can significantly impact the valuation. What is the reason for the share price sitting below the intrinsic value? For Sabre, we've compiled three pertinent items you should assess:

  1. Risks: We feel that you should assess the 3 warning signs for Sabre (1 shouldn't be ignored!) we've flagged before making an investment in the company.

  2. Future Earnings: How does SABR's growth rate compare to its peers and the wider market? Dig deeper into the analyst consensus number for the upcoming years by interacting with our free analyst growth expectation chart.

  3. Other Solid Businesses: Low debt, high returns on equity and good past performance are fundamental to a strong business. Why not explore our interactive list of stocks with solid business fundamentals to see if there are other companies you may not have considered!

Present Value of 10-year Cash Flow (PVCF) = US$2.9b


LADIS 2009: More reading | Amazon AWS | First time visit

Aug. 17, 2021

Here is the link. 

I like to spend a few hours to look into the conference. 


XOM stock: One of top 10 oil companies in the world

 Aug. 17, 2021

Exxon Mobil No Longer Has A $48 Billion Shortfall

Aug. 16, 2021 8:49 AM ETExxon Mobil Corporation (XOM)95 Comments45 Likes

Summary

  • Exxon Mobil no longer has a $48 billion shortfall with its cut capital expenditures and rising cash flow.
  • The company has been able to pay dividends of more than 6% and it has continued to aggressively pay down the debt it got.
  • Going forward, the company has the ability to drive incredibly strong shareholder returns making it a valuable long-term investment at its current valuation.
  • I do much more than just articles at The Energy Forum: Members get access to model portfolios, regular updates, a chat room, and more.

Exxon Mobil (NYSE: XOM) recently reported quarterly earnings with an almost $250 billion market capitalization. The company recently reported incredibly strong earnings as it continues to support an almost 6% dividend yield with significant long-term growth potential. With this potential, we recommend investing in Exxon Mobil as a valuable long-term investment, with higher prices reducing the company's chance of its shortfall.

Exxon Mobil Recent Developments

Exxon Mobil has had a number of recent developments highlighting the continued strength of its portfolio.

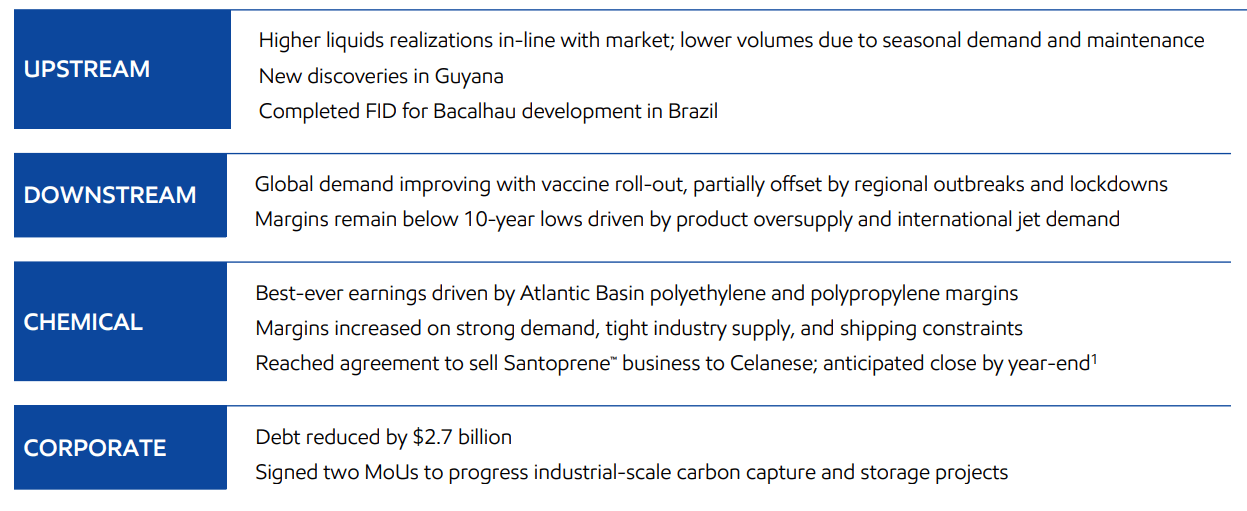
Exxon Mobil Recent Developments - Exxon Mobil Investor Presentation

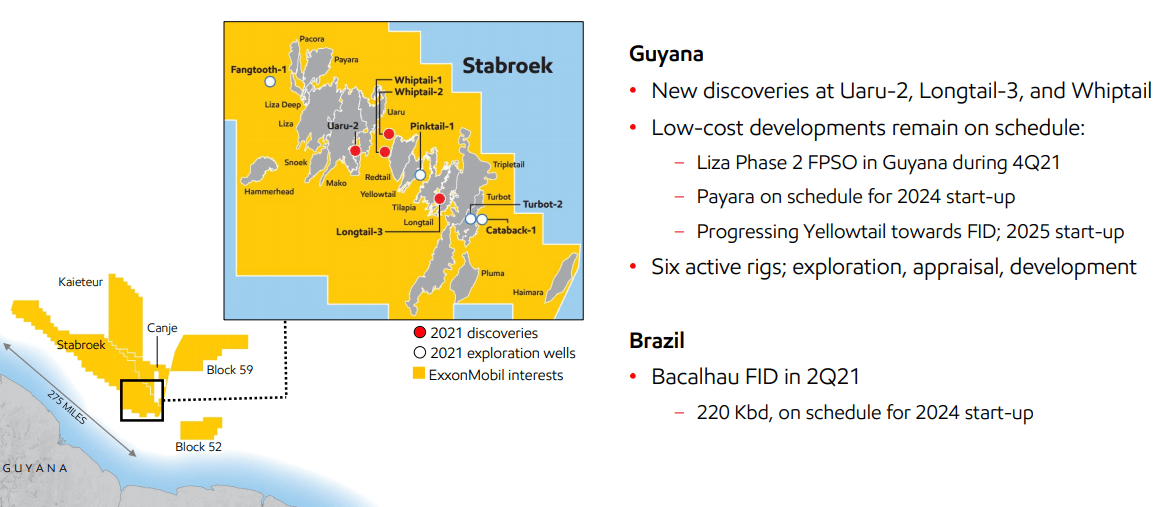
Exxon Mobil continued to have new Guyana discoveries in its upstream portfolio, with a completed FID for its Bacalhau development. The company's offshore production has the potential to generate strong long-term production growth. On the downstream sector, the company's global demand is supported by the vaccine rollout which should help with long-term growth.

The company has continued to use its cash flow strength to improve its financial position.

Exxon Mobil Disciplined Cash Profile

Exxon Mobil, putting this together, is focused on a strong cash profile to generate strong shareholder rewards.

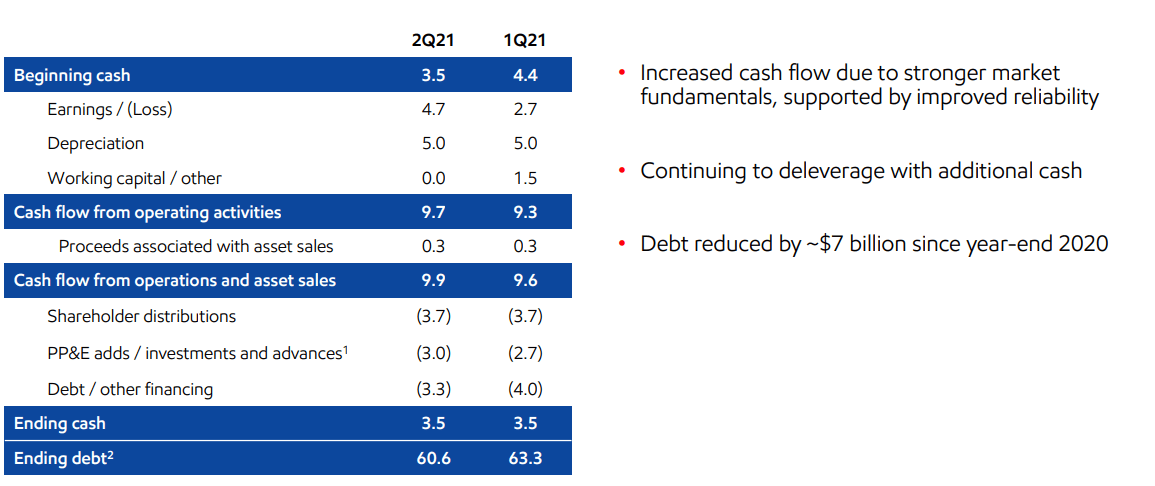
Exxon Mobil Cash Profile - Exxon Mobil Investor Presentation

Exxon Mobil started 1Q 2021 with $4.4 billion in cash and $9.3 billion in cash flow from operations (with $0.3 billion in asset sales). The company ended the quarter with $3.5 billion in cash after paying off $4 billion in debt. In 2Q 2021, it kept its cash constant after paying off $3.3 billion in debt. The company has paid a dividend of more than 6% while reducing debt by $7 billion since YE.

The company can be expected to continue earning strong cash flow and drive it towards strong shareholder rewards.

Exxon Mobil Investment Returns

Exxon Mobil projects and capital spending have the ability to generate incredibly strong investment returns.

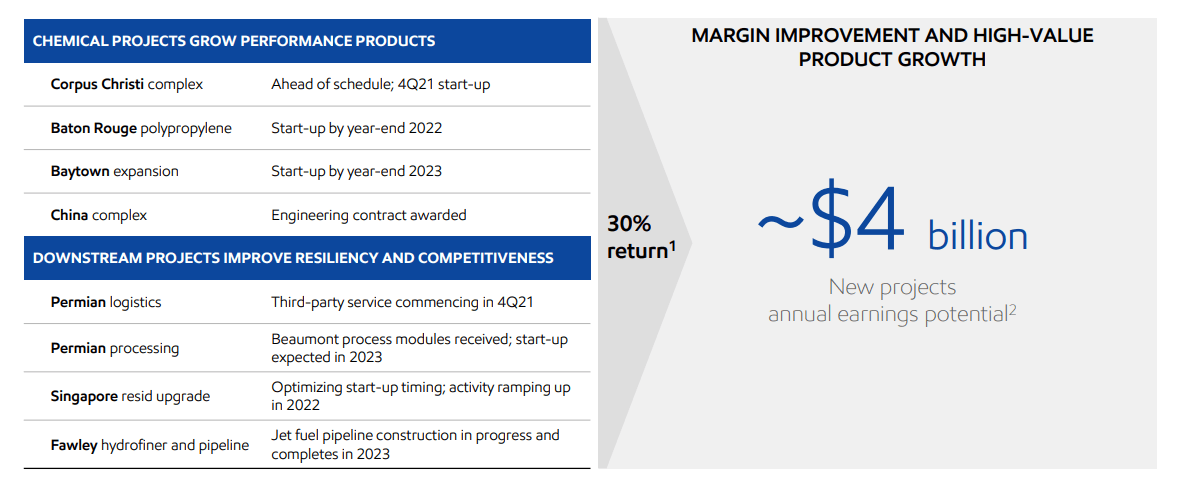
Exxon Mobil Future Investment - Exxon Mobil Investor Presentation

The company's projects are focused on a 30% return from chemical and downstream projects with ~$4 billion in annual earnings potential from its new projects. These projects are massive for the company, when they alone can give the company a P/E ratio of 60. These projects integrate well into the company's existing assets.

Exxon Mobil Upstream

Delving deeper in, Exxon Mobil has significant longer term growth potential from its upstream asset portfolio.

Exxon Mobil Permian Basin - Exxon Mobil Investor Presentation

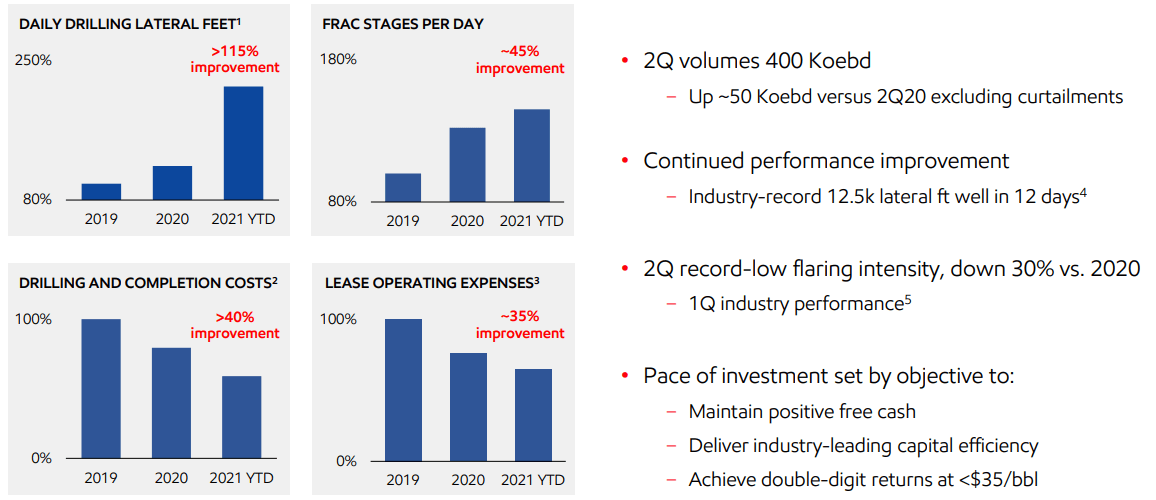
The company saw 2Q 2021 volumes of 400 thousand barrels/day. That was a 50 thousand barrel/day YoY increase with the company continuing to reduce expenses and generate massive performance improvements. The company delivers double-digit returns here at <$35/barrel and while it delayed the plans due to the COVID-19 collapse, can ramp up production.

The company much higher potential business for the long-term lies in its offshore development assets though.

Exxon Mobil Deepwater - Exxon Mobil Investor Presentation

The company has made 3 more discoveries in Guyana, an area where its average discovery size has been a massive 500 million barrels. The company has 4 more expected exploration wells which have the potential to discover another 2 billion barrels with expanding to new areas, known oil fields in the company's Stabroek block.

The company's Liza Phase 2 FPSO is expected to start up in Guyana towards the end of the year. The company's Payara is on schedule for a 2024 start-up, pointing towards more than half a million barrels / day of production from the asset. The company's Yellowtail is proceeding towards FID with a 2025 start-up.

The company continues to have 6 active rigs, and we see the potential for a 1 new FPSO a year going well into the 2030s. In Brazil, the company's deepwater assets are several years behind Guyana but still progressing admirably. The company's Bacalhau FID is in 2Q 2021 and the 220 thousand barrels / day FPSO is on schedule for a 2024 start-up.

Exxon Mobil Shareholder Value

Putting all of this together, Exxon Mobil is focused on generating strong shareholder rewards.

Exxon Mobil Shareholder Returns - Exxon Mobil Investor Presentation

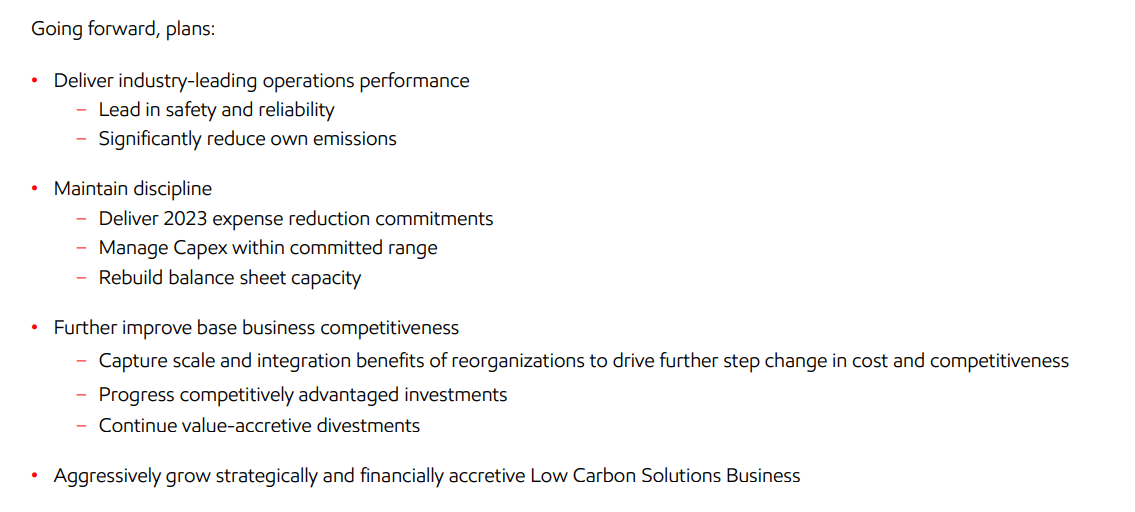
Exxon Mobil is focused on generating massive shareholder value. The company plans to reduce expenses and manage capital expenditures while growing its overall balance sheet capacity. The company is focused on improving its base business competitiveness and we expect that, with its overall balance sheet improvements, it'll generate strong shareholder rewards.

One downside here is that Exxon Mobil is in the midst of a maintenance schedule from last year. That difference will cost the company roughly $500 million in earnings for the next quarter. However, it's worth noting the $48 billion shortfall was calculated at prices roughly $30 / barrel below current prices.

Exxon Mobil's production is more than 1 billion barrels/year meaning that the rise in current prices means $10s of billions in additional cash flow. That's massive with the company's current $240 billion market capitalization and it means the company has the ability to drive incredibly strong shareholder rewards.

Exxon Mobil Risk

Exxon Mobil's risk of course is oil prices. At $70/barrel the company has the ability to generate a massive amount of cash flow, however, there's no guarantee that prices will remain at that level forever. That's a risk worth paying close attention to for investors, there's no guarantee that prices will remain at their current level forever.

It's a simple risk but one that affects all oil companies.

Conclusion

Exxon Mobil has an impressive portfolio of assets and the ability to utilize those assets to drive substantial shareholder returns. The company has significant upstream assets that are growing with Guyana having the potential to have 1 FPSO a year in 2024 onwards and Brazil having the potential to start its first FPSO around the same time.

These assets have the potential to generate substantial shareholder rewards, which is something worth paying close attention to. The company, with current oil prices, has the ability to cover its dividend, which is still more than 6%, a substantial capital program, and continuing to pay down debt. All of that strength makes Exxon Mobil a valuable investment.


Dean Keynote Ladis 2009: My notes | 60+ minutes study

Aug. 17, 2021

I like to take some notes and relax, and learn a few things. 

The notes link is here. 

I looked up the website for Ladis 2009, and then the link is here to slides. 

Numbers everyone should know 

  • L1 cache reference 0.5 ns
  • Branch mispredict  5 ns
  • L2 cache reference 7 ns
  • Mutex lock/ unlock 25 ns
  • Main memory reference 100 ns
  • Compress 1K bytes with Zippy 3,000 ns
  • Send 2K bytes over 1 Gbps network  20,000 ns
  • Read 1 MB sequentially from memory 250,000 ns
  • Round trip within same datacenter 500,000 ns
  • Disk seek                                       10,000,000 ns
  • Read 1 MB sequentially from disk  20,000,000 ns
  • Send packet CA->Netherlands->CA 150,000,000 ns
Designing efficient systems 
Given a basic problem definition, how do you choose the "best" solution?
  • Best could be simplest, highest performance, easiest to extend, etc.
Important skill: ability to estimate performance of a system design
   - without actually having to build it!

Architectural view of the storage hierarchy

One server
DRAM: 16GB, 100ns, 20GB/s
Disk: 2TB, 10ms, 200MB/s

Rack Switch 
Local rack ( 80 servers)
DRAM: 1TB, 300us, 100MB/s
Disk: 160TB, 11ms, 100MB/s

Cluster (30+ racks)
DRAM: 30TB, 500us, 10MB/s
Disk: 4.80PB, 12ms, 10MB/s

 Back of the envelope calculations

How long to generate image results page (30 thumbnails)?

Design 1: Read serially, thumbnail 256K images on the fly
30 seeks * 10 ms/ seek + 30 * 256K /30 MB/s = 560 ms

Design 2: Issues reads in parallel:
10 ms/ seek + 256K read / 30 MB/s = 18 ms

(Ignores variance, so really more like 30-60 ms, probably)

Lots of variations:
  • caching (single images? whole sets of thumbnails?)
  • pre-computing thumbnails
  • ...
Back of the envelope helps identify most promising...

Know your basic building blocks
Core language libraries, basic data structure, protocol buffers, GFS, BigTable, indexing systems, MySQL, MapReduce, ...

Not just their interfaces, but understand their implementations (at least at a high level)

If you don't know what's going on, you can't do decent back-of-the-envelope calculations!

MapReduce
  • A simple programming model that applies to many large-scale computing problems
  • Hide messy details in MapReduce runtime library:
    • automatic parallelization
    • load balancing
    • network and disk transfer optimizations
    • handling of machine failures
    • robustness
    • improvements to core library benefit all users of library!
Typical problem solved by MapReduce
  • Read a lot of data
  • Map: extract something you care about from each record
  • Shuffle and Sort
  • Reduce: aggregate, summarize, filter, or transform
  • Write the results
Outline stays the same, map and reduce change to fit the problem

BigTable: Motivation
  • Lots of (semi-) structured data at Google
    • URLs:
      • contents, crawl metadata, links, anchors, pagerank, ...
    • Per-user data:
      • User preference settings, recent queries/search results, ...
    • Geographic locations:
      • Physical entities (shops, restaurants, etc.), roads, satellite image data, user annotations, ...
  • Scale is large
    • billions of URLs, many versions/page (~20K/ version)
    • Hundreds of millions of users, thousands of q/sec
    • 100TB+ of satellite image data
Basic data model
  • Distributed multi-dimensional sparse map (row, column, timestamp) -> cell contents
Rows are ordered lexicographically
Good match for most of our applications


BigTable status
  • Design/initial implementation started beginning of 2004
  • Production use or active development for 100+ projects:
    • Google Print
    • My Search History
    • Orkut
    • Crawling/indexing pipeline
    • Google Maps/Google Earth
    • Blogger
    • ...
  • Currently ~500 BigTable clusters
  • Largest cluster:
    • 70+ PB data; sustained: 10M ops/sec; 30+ GB/s I/O
Current work: Spanner
  • Storage & computation system that spans all our datacenters
    • single global namespace
      • Names are independent of location(s) of data
      • Similarities to Bigtable: tables, families, locality groups, coprocessors, ...
      • Differences: hierarchical directories instead of rows, fine-grained replication
      • Fine-grained ACLs, replication configuration at the per-directory level
    • support mix of strong and weak consistency across datacenters
      • strong consistency implemented with Paxos across tablet replicas
      • Full support for distributed transactions across directories/machines
    • much more automated operation
      • system automatically moves and adds replicas of data and computation based on constraints and usage patterns
      • automated allocation of resources across entire fleet of machines
Activities in world-wide systems
  • Challenge: automatic, dynamic world-wide placement of data & computation to minimize latency and/or cost, given constraints on:
    • bandwidth
    • packet loss
    • power
    • resource usage
    • failure modes
    • ...

  • User specify high-level desires:
    • "99%ile latency for accessing this data should be <50ms"
    • Store this data on at least 2 disks in EU, 2 in U.S. & 1 in Asia
Building applications on top of weakly consistent storage systems
  • Many applications need state replicated across a wide area 
    • For reliability and availability 
  • Two main choices:
    • consistent operations (e.g. use Paxos)
      • often imposes additional latency for common case
    • inconsistent operations
      • better performance/availability, but apps harder to write and reason about in this model
  • Many apps need to use a mix of both of these:
    • e.g. Gmail: marking a message as read is asynchronous, sending a message is a heavier-weight consistent operation
Building application on top of Weakly Consistent Storage Systems 
  • Challenge: General model of consistency choices, explained and codified
    • ideally would have one or more "knobs" controlling performance vs. consistency
    • "knob" would provide easy-to-understand tradeoffs
  • Challenges: Easy-to-use abstractions for resolving conflicting updates to multiple versions of a piece of state
    • Useful for reconciling client state with servers after disconnected operation
    • Also useful for reconciling replicated state in different data centers after repairing a network partition

  Further readings:
  1. Google File system, SOSP 2003
  2. Web search for a palnet: The Google Cluster Architecture, IEEE Micro, 2023
  3. OSDI 2004, MapReduce: Simplified Data processing on Large Clusters
  4. OSDI 2006, Bigtable: A distributed storage system for structured data 
  5. OSDI 2006, The Chubby Lock service for loosely-coupled distributed systems
  6. FAST 2007, Failure trends in a large disk drive population 
  7. EMNLP 2007, Large language models in Machine translation
  8. 2009, The datacenter as a computer: An introduction to the design of Warehouse-Scale machines
  9. 2009, PODC, Pregel: A system for large-scale graph processing 
  10. SEGMETRICS'09, DRAM Errors in the Wild: A Large-Scale Field study 
  11. Protocol buffers. http://code.goolge.com/p/protobuf/


Paper reading: WEBSEARCH FOR A PLANET: THE GOOGLECLUSTER ARCHITECTURE | August 19, 2021 60+ minutes study

Aug. 17, 2021

Here is the paper. 

AMENABLE TO EXTENSIVE PARALLELIZATION, GOOGLE’S WEB SEARCH APPLICATION LETS DIFFERENT QUERIES RUN ON DIFFERENT PROCESSORS AND, BY PARTITIONING THE OVERALL INDEX, ALSO LETS A SINGLE QUERY USE MULTIPLE PROCESSORS. TO HANDLE THIS WORKLOAD, GOOGLE’S ARCHITECTURE FEATURES CLUSTERS OF MORE THAN 15,000 COMMODITYCLASS PCS WITH FAULT-TOLERANT SOFTWARE. THIS ARCHITECTURE ACHIEVES SUPERIOR PERFORMANCE AT A FRACTION OF THE COST OF A SYSTEM BUILT FROM FEWER, BUT MORE EXPENSIVE, HIGH-END SERVERS.

Few Web services require as much computation per request as search engines. On average, a single query on Google reads hundreds of megabytes of data and consumes tens of billions of CPU cycles. Supporting a peak request stream of thousands of queries per second requires an infrastructure comparable in size to that of the largest supercomputer installations. Combining more than 15,000 commodity-class PCs with fault-tolerant software creates a solution that is more cost-effective than a comparable system built out of a smaller number of high-end servers .

Here we present the architecture of the Google cluster, and discuss the most important factors that influence its design: energy efficiency and price-performance ratio. Energy efficiency is key at our scale of operation, as power consumption and cooling issues become significant operational factors, taxing the limits of available data center power densities.

Our application affords easy parallelization: Different queries can run on different processors, and the overall index is partitioned so that a single query can use multiple processors. Consequently, peak processor performance is less important than its price/ performance. As such, Google is an example of a throughput-oriented workload, and should benefit from processor architectures that offer more on-chip parallelism, such as simultaneous multithreading or on-chip multiprocessors.

Google architecture overview 

Google’s software architecture arises from two basic insights. First, we provide reliability in software rather than in server-class hardware, so we can use commodity PCs to build a high-end computing cluster at a low-end price. Second, we tailor the design for best aggregate request throughput, not peak server response time, since we can manage response times by parallelizing individual requests.

We believe that the best price/performance tradeoff for our applications comes from fashioning a reliable computing infrastructure from clusters of unreliable commodity PCs. We provide reliability in our environment at the software level, by replicating services across many different machines and automatically detecting and handling failures. This software based reliability encompasses many different areas and involves all parts of our system design. Examining the control flow in handling a query provides insight into the high level structure of the query-serving system, as well as insight into reliability considerations.

Serving a Google query 

When a user enters a query to Google (such as www.google.com/search?q=ieee+society), the user’s browser first performs a domain name system (DNS) lookup to map www.google.com to a particular IP address. To provide sufficient capacity to handle query traffic, our service consists of multiple clusters distributed worldwide. Each cluster has around a few thousand machines, and the geographically distributed setup protects us against catastrophic data center failures (like those arising from earthquakes and large-scale power failures). A DNS-based load-balancing system selects a cluster by accounting for the user’s geographic proximity to each physical cluster. The load-balancing system minimizes round-trip time for the user’s request, while also considering the available capacity at the various clusters.

The user’s browser then sends a hypertext transport protocol (HTTP) request to one of these clusters, and thereafter, the processing of that query is entirely local to that cluster. A hardware-based load balancer in each cluster monitors the available set of Google Web servers (GWSs) and performs local load balancing of requests across a set of them. After receiving a query, a GWS machine coordinates the query execution and formats the results into a Hypertext Markup Language (HTML) response to the user’s browser. Figure 1 illustrates these steps.

Query execution consists of two major phases.1 In the first phase, the index servers consult an inverted index that maps each query word to a matching list of documents (the hit list). The index servers then determine a set of relevant documents by intersecting the hit lists of the individual query words, and they compute a relevance score for each document. This relevance score determines the order of results on the output page.

Let me put together those new terms:

  1. several tens of terabytes of uncompressed data
  2. the inverted index resulting from this raw data 
  3. dividing the index into pieces (index shards)
  4. each having a randomly chosen subset of documents from the full index
  5. A pool of machines serves requests for each shard
  6. several tens of terabytes of uncompressed data -> the inverted index - many terabytes of data
  7. index -> index shards 
  8. parallelizable -> a randomly chosen subset of documents from the full index 

The search process is challenging because of the large amount of data: The raw documents comprise several tens of terabytes of uncompressed data, and the inverted index resulting from this raw data is itself many terabytes of data. Fortunately, the search is highly parallelizable by dividing the index into pieces (index shards), each having a randomly chosen subset of documents from the full index. A pool of machines serves requests for each shard, and the overall index cluster contains one pool for each shard. Each request chooses a machine within a pool using an intermediate load balancer—in other words, each query goes to one machine (or a subset of machines) assigned to each shard. If a shard’s replica goes down, the load balancer will avoid using it for queries, and other components of our cluster-management system will try to revive it or eventually replace it with another machine. During the downtime, the system capacity is reduced in proportion to the total fraction of capacity that this machine represented. However, service remains uninterrupted, and all parts of the index remain available.

The final result of this first phase of query execution is an ordered list of document identifiers (docids). As Figure 1 shows, the second phase involves taking this list of docids and computing the actual title and uniform resource locator of these documents, along with a query-specific document summary. Document servers (docservers) handle this job, fetching each document from disk to extract the title and the keyword-in-context snippet. As with the index lookup phase, the strategy is to partition the processing of all documents by 

  • randomly distributing documents into smaller shards 
  • having multiple server replicas responsible for handling each shard, and 
  • routing requests through a load balancer.
The docserver cluster must have access to an online, low-latency copy of the entire Web. In fact, because of the replication required for performance and availability, Google stores dozens of copies of the Web across its clusters.

In addition to the indexing and document serving phases, a GWS also initiates several other ancillary tasks upon receiving a query, such as sending the query to a spell-checking system and to an ad-serving system to generate relevant advertisements (if any). When all phases are complete, a GWS generates the appropriate HTML for the output page and returns it to the user’s browser.

Using replication for capacity and fault-tolerance 

We have structured our system so that most accesses to the index and other data structures involved in answering a query are read-only: Updates are relatively infrequent, and we can often perform them safely by diverting queries away from a service replica during an update. This principle sidesteps many of the consistency issues that typically arise in using a general-purpose database.

We also aggressively exploit the very large amounts of inherent parallelism in the application: For example, we transform the lookup of matching documents in a large index into many lookups for matching documents in a set of smaller indices, followed by a relatively inexpensive merging step. Similarly, we divide the query stream into multiple streams, each handled by a cluster. Adding machines to each pool increases serving capacity, and adding shards accommodates index growth. By parallelizing the search over many machines, we reduce the average latency necessary to answer a query, dividing the total computation across more CPUs and disks. Because individual shards don’t need to communicate with each other, the resulting speedup is nearly linear. In other words, the CPU speed of the individual index servers does not directly influence the search’s overall performance, because we can increase the number of shards to accommodate slower CPUs, and vice versa. Consequently, our hardware selection process focuses on machines that offer an excellent request throughput for our application, rather than machines that offer the highest single thread performance.

In summary, Google clusters follow three key design principles: 

  • Software reliability. We eschew fault-tolerant hardware features such as redundant power supplies, a redundant array of inexpensive disks (RAID), and high quality components, instead focusing on tolerating failures in software.
  • Use replication for better request throughput and availability. Because machines are inherently unreliable, we replicate each of our internal services across many machines. Because we already replicate services across multiple machines to obtain sufficient capacity, this type of fault tolerance almost comes for free.
  • Price/performance beats peak performance. We purchase the CPU generation that currently gives the best performance per unit price, not the CPUs that give the best absolute performance.
  • Using commodity PCs reduces the cost of computation. As a result, we can afford to use more computational resources per query, employ more expensive techniques in our ranking algorithm, or search a larger index of documents.
Leveraging commodity parts 

Google’s racks consist of 40 to 80 x86-based servers mounted on either side of a custom made rack (each side of the rack contains twenty 20u or forty 1u servers). Our focus on price/performance favors servers that resemble mid-range desktop PCs in terms of their components, except for the choice of large disk drives. Several CPU generations are in active service, ranging from single-processor 533- MHz Intel-Celeron-based servers to dual 1.4- GHz Intel Pentium III servers. Each server contains one or more integrated drive electronics (IDE) drives, each holding 80 Gbytes. Index servers typically have less disk space than document servers because the former have a more CPU-intensive workload. The servers on each side of a rack interconnect via a 100-Mbps Ethernet switch that has one or two gigabit uplinks to a core gigabit switch that connects all racks together.

Our ultimate selection criterion is cost per query, expressed as the sum of capital expense (with depreciation) and operating costs (hosting, system administration, and repairs) divided by performance. Realistically, a server will not last beyond two or three years, because of its disparity in performance when compared to newer machines. Machines older than three years are so much slower than current-generation machines that it is difficult to achieve proper load distribution and configuration in clusters containing both types. Given the relatively short amortization period, the equipment cost figures prominently in the overall cost equation.

Because Google servers are custom made, we’ll use pricing information for comparable PC-based server racks for illustration. For example, in late 2002 a rack of 88 dual-CPU 2-GHz Intel Xeon servers with 2 Gbytes of RAM and an 80-Gbyte hard disk was offered on RackSaver.com for around $278,000. This figure translates into a monthly capital cost of $7,700 per rack over three years. Personnel and hosting costs are the remaining major contributors to overall cost.

The relative importance of equipment cost makes traditional server solutions less appealing for our problem because they increase performance but decrease the price/performance. For example, four-processor motherboards are expensive, and because our application parallelizes very well, such a motherboard doesn’t recoup its additional cost with better performance. Similarly, although SCSI disks are faster and more reliable, they typically cost two or three times as much as an equal-capacity IDE drive.

The cost advantages of using inexpensive, PC-based clusters over high-end multiprocessor servers can be quite substantial, at least for a highly parallelizable application like ours. The example $278,000 rack contains 176 2-GHz Xeon CPUs, 176 Gbytes of RAM, and 7 Tbytes of disk space. In comparison, a typical x86-based server contains eight 2-GHz Xeon CPUs, 64 Gbytes of RAM, and 8 Tbytes of disk space; it costs about $758,000. In other words, the multiprocessor server is about three times more expensive but has 22 times fewer CPUs, three times less RAM, and slightly more disk space. Much of the cost difference derives from the much higher interconnect bandwidth and reliability of a high-end server, but again, Google’s highly redundant architecture does not rely on either of these attributes.

Operating thousands of mid-range PCs instead of a few high-end multiprocessor servers incurs significant system administration and repair costs. However, for a relatively homogenous application like Google, where most servers run one of very few applications, these costs are manageable. Assuming tools to install and upgrade software on groups of machines are available, the time and cost to maintain 1,000 servers isn’t much more than the cost of maintaining 100 servers because all machines have identical configurations. Similarly, the cost of monitoring a cluster using a scalable application-monitoring system does not increase greatly with cluster size. Furthermore, we can keep repair costs reasonably low by batching repairs and ensuring that we can easily swap out components with the highest failure rates, such as disks and power supplies.

The power problem 

Even without special, high-density packaging, power consumption and cooling issues can become challenging. A mid-range server with dual 1.4-GHz Pentium III processors draws about 90 W of DC power under load: roughly 55 W for the two CPUs, 10 W for a disk drive, and 25 W to power DRAM and the motherboard. With a typical efficiency of about 75 percent for an ATX power supply, this translates into 120 W of AC power per server, or roughly 10 kW per rack. A rack comfortably fits in 25 ft2 of space, resulting in a power density of 400 W/ft2 . With higher-end processors, the power density of a rack can exceed 700 W/ft2 .

Unfortunately, the typical power density for commercial data centers lies between 70 and 150 W/ft2 , much lower than that required for PC clusters. As a result, even low-tech PC clusters using relatively straightforward packaging need special cooling or additional space to bring down power density to that which is tolerable in typical data centers. Thus, packing even more servers into a rack could be of limited practical use for large-scale deployment as long as such racks reside in standard data centers. This situation leads to the question of whether it is possible to reduce the power usage per server.

Reduced-power servers are attractive for large-scale clusters, but you must keep some caveats in mind. First, reduced power is desirable, but, for our application, it must come without a corresponding performance penalty: What counts is watts per unit of performance, not watts alone. Second, the lower-power server must not be considerably more expensive, because the cost of depreciation typically outweighs the cost of power. The earlier-mentioned 10 kW rack consumes about 10 MW-h of power per month (including cooling overhead). Even at a generous 15 cents per kilowatt-hour (half for the actual power, half to amortize uninterruptible power supply [UPS] and power distribution equipment), power and cooling cost only $1,500 per month. Such a cost is small in comparison to the depreciation cost of $7,700 per month. Thus, low-power servers must not be more expensive than regular servers to have an overall cost advantage in our setup.

Hardware-level application characteristics 

Examining various architectural characteristics of our application helps illustrate which hardware platforms will provide the best price/performance for our query-serving system. We’ll concentrate on the characteristics of the index server, the component of our infrastructure whose price/performance most heavily impacts overall price/performance. The main activity in the index server consists of decoding compressed information in the inverted index and finding matches against a set of documents that could satisfy a query. Table 1 shows some basic instruction-level measurements of the index server program running on a 1-GHz dual processor Pentium III system.

The application has a moderately high CPI, considering that the Pentium III is capable of issuing three instructions per cycle. We expect such behavior, considering that the application traverses dynamic data structures and that control flow is data dependent, creating a significant number of difficult-to-predict branches. In fact, the same workload running on the newer Pentium 4 processor exhibits nearly twice the CPI and approximately the same branch prediction performance, even though the Pentium 4 can issue more instructions concurrently and has superior branch prediction logic. In essence, there isn’t that much exploitable instruction-level parallelism (ILP) in the workload. Our measurements suggest that the level of aggressive out-of-order, speculative execution present in modern processors is already beyond the point of diminishing performance returns for such programs.

A more profitable way to exploit parallelism for applications such as the index server is to leverage the trivially parallelizable computation. Processing each query shares mostly read only data with the rest of the system, and constitutes a work unit that requires little communication. We already take advantage of that at the cluster level by deploying large numbers of inexpensive nodes, rather than fewer high end ones. Exploiting such abundant thread level parallelism at the microarchitecture level appears equally promising. Both simultaneous multithreading (SMT) and chip multiprocessor (CMP) architectures target thread-level parallelism and should improve the performance of many of our servers. Some early experiments with a dual-context (SMT) Intel Xeon processor show more than a 30 percent performance improvement over a single-context setup. This speedup is at the upper bound of improvements reported by Intel for their SMT implementation.

We believe that the potential for CMP systems is even greater. CMP designs, such as Hydra and Piranha, seem especially promising. In these designs, multiple (four to eight) simpler, in-order, short-pipeline cores replace a complex high-performance core. The penalties of in-order execution should be minor given how little ILP our application yields, and shorter pipelines would reduce or eliminate branch mispredict penalties. The available thread-level parallelism should allow near-linear speedup with the number of cores, and a shared L2 cache of reasonable size would speed up interprocessor communication.

Memory system 

Table 1 also outlines the main memory system performance parameters. We observe good performance for the instruction cache and instruction translation look-aside buffer, a result of the relatively small inner-loop code size. Index data blocks have no temporal locality, due to the sheer size of the index data and the unpredictability in access patterns for the index’s data block. However, accesses within an index data block do benefit from spatial locality, which hardware prefetching (or possibly larger cache lines) can exploit. The net effect is good overall cache hit ratios, even for relatively modest cache sizes. 

Memory bandwidth does not appear to be a bottleneck. We estimate the memory bus utilization of a Pentium-class processor system to be well under 20 percent. This is mainly due to the amount of computation required (on average) for every cache line of index data brought into the processor caches, and to the data-dependent nature of the data fetch stream. In many ways, the index server’s memory system behavior resembles the behavior reported for the Transaction Processing Performance Council’s benchmark D (TPC-D). For such workloads, a memory system with a relatively modest sized L2 cache, short L2 cache and memory latencies, and longer (perhaps 128 byte) cache lines is likely to be the most effective.

Large-scale multiprocessing 

As mentioned earlier, our infrastructure consists of a massively large cluster of inexpensive desktop-class machines, as opposed to a smaller number of large-scale shared memory machines. Large shared-memory machines are most useful when the computation-to-communication ratio is low; communication patterns or data partitioning are dynamic or hard to predict; or when total cost of ownership dwarfs hardware costs (due to management overhead and software licensing prices). In those situations they justify their high price tags.

At Google, none of these requirements apply, because we partition index data and computation to minimize communication and evenly balance the load across servers. We also produce all our software in-house, and minimize system management overhead through extensive automation and monitoring, which makes hardware costs a significant fraction of the total system operating expenses. Moreover, large-scale shared-memory machines still do not handle individual hardware component or software failures gracefully, with most fault types causing a full system crash. By deploying many small multiprocessors, we contain the effect of faults to smaller pieces of the system. Overall, a cluster solution fits the performance and availability requirements of our service at significantly lower costs.

At first sight, it might appear that there are few applications that share Google’s characteristics, because there are few services that require many thousands of servers and petabytes of storage. However, many applications share the essential traits that allow for a PC-based cluster architecture. As long as an application orientation focuses on the price/performance and can run on servers that have no private state (so servers can be replicated), it might benefit from using a similar architecture. Common examples include high volume Web servers or application servers that are computationally intensive but essentially stateless. All of these applications have plenty of request-level parallelism, a characteristic exploitable by running individual requests on separate servers. In fact, larger Web sites already commonly use such architectures.

At Google’s scale, some limits of massive server parallelism do become apparent, such as the limited cooling capacity of commercial data centers and the less-than-optimal fit of current CPUs for throughput-oriented applications. Nevertheless, using inexpensive PCs to handle Google’s large-scale computations has drastically increased the amount of computation we can afford to spend per query, thus helping to improve the Internet search experience of tens of millions of users.