Tuesday, October 5, 2021

EQT stock: Gas industry

 作为原油的替代能源之一的天然气,最近也有不错的上涨行情。上周我们已经深度分析过EQT能源,代号EQT, 是美国最大的天然气生产商,市值77亿美元。昨天大盘全线暴跌情况下,逆势大涨4%。

它的信用状况在同行中也是最好的,这使它能够获得低成本债务,并进一步降低成本。这些因素使EQT能够产生可观的自由现金流。预计到2026年,EQT累计自由现金流将超过70亿美元。与此同时,如果价格上涨,它还有上行潜力。EQT预计近期将使用部分自由现金流偿还债务。到2026年,只有27亿美元的债务到期,该公司将有充足的多余现金用于其他股东友好的活动,如股息、股票回购和增值收购。

我们刚刚说到原油大佬们已经赚的盆满钵满了,但另一边的天然气空头们则是面临着爆仓风险。随着全球天然气期货价格暴涨,全球最大的大宗商品交易商嘉能可(Glencore)、贡沃尔(Gunvor)、托克(Trafigura)和维托尔(Vitol)等在欧美天然气市场的头寸都面临巨额追加保证金要求。

多年来,欧洲(红色)和美国(绿色)天然气的价格一直在一个明确的范围内交易。当两者之间的价差达到一个或另一个极端时,你买一个,卖另一个——很简单,对吧?


因此,随着欧洲天然气价格在第二季度飙升,相对于美国天然气价格达到了一个显著的极端,促使交易员采取出售欧洲天然气、购买美国天然气的策略,希望息差能缩小。


然而,上个月,由于库存低、亚洲天然气需求高、俄罗斯和液化天然气供应不足、供应中断等多种因素,欧洲天然气价格大幅上涨,这一战略出现了事与愿违的结果。


尤其对中小型交易公司来说,情况更为困难。消息人士称,追加保证金的规模是前所未有的,贸易公司和其他玩家一起已经积累了300亿美元的空头头寸。


历史上,天然气板块每次都当作投机题材来炒作,因为紧缺和涨价没有持续性,天然气板块每年都是冬天炒一波,然后结束。但这一次,天然气淡季不淡,以往冬季才上涨的,七月份就开始了大涨行情。所以预期价格上涨的持续性和幅度均会大超预期。

另外,今年欧洲也遭遇了“灾难性”的天然气危机,挪威、俄罗斯的天然气供应减少,但页岩开采热潮却使得美国变成了世界主要天然气出口国。今年美国出口海外的天然气较同期增加了近50%,这也间接导致了本土天然气供应紧张。


还有,新产能建设周期长。目前新投产的液化天然气产能通常是2016年前后立项建设的。上游炼化厂的建设周期较长,从决定投资到完全建成通常需要4-5年。供需错配+下游景气带来的产品涨价,以及政策支持,是天然气市场最硬核的上涨逻辑。


欧洲和亚洲的天然气基准价格相当于190美元/桶的原油价格,是当前布油价格的一倍多。


从需求方面看,根据美国能源信息署的数据,大约一半的美国家庭使用天然气来取暖和取暖。如果冬天大家供暖需求攀升,将会进一步推高天然气价格。它的价格在过去12个月飙升了 180% 以上,达到每百万英热单位 5.9 美元。这也是自从2014年2月以来,天然气价格最高的水平。所以大家也要做好心理准备:今年冬天,暖气费可能飙升,钱包又要缩水了.....


OPIS能源公司创始人 Tom Kloza提醒,今年秋天和冬天,大家要为家庭供暖成本的冲击做好准备。“如果你的暖气费去年是150美元,今年可能是300美元,史上“最贵”的冬天要来了。”


Facebook engineering: Storage | Needle in a haystack: efficient storage of billions of photos

Here is the article. 

POSTED ON  TO CORE DATA 

The Photos application is one of Facebook’s most popular features. Up to date, users have uploaded over 15 billion photos which makes Facebook the biggest photo sharing website. For each uploaded photo, Facebook generates and stores four images of different sizes, which translates to a total of 60 billion images and 1.5PB of storage. The current growth rate is 220 million new photos per week, which translates to 25TB of additional storage consumed weekly. At the peak there are 550,000 images served per second. These numbers pose a significant challenge for the Facebook photo storage infrastructure.

NFS photo infrastructure

The old photo infrastructure consisted of several tiers:

  • Upload tier receives users’ photo uploads, scales the original images and saves them on the NFS storage tier.
  • Photo serving tier receives HTTP requests for photo images and serves them from the NFS storage tier.
  • NFS storage tier built on top of commercial storage appliances.

Since each image is stored in its own file, there is an enormous amount of metadata generated on the storage tier due to the namespace directories and file inodes. The amount of metadata far exceeds the caching abilities of the NFS storage tier, resulting in multiple I/O operations per photo upload or read request. The whole photo serving infrastructure is bottlenecked on the high metadata overhead of the NFS storage tier, which is one of the reasons why Facebook relies heavily on CDNs to serve photos. Two additional optimizations were deployed in order to mitigate this problem to some degree:

  • Cachr: a caching server tier caching smaller Facebook “profile” images.
  • NFS file handle cache – deployed on the photo serving tier eliminates some of the NFS storage tier metadata overhead

Haystack Photo Infrastructure

The new photo infrastructure merges the photo serving tier and storage tier into one physical tier. It implements a HTTP based photo server which stores photos in a generic object store called Haystack. The main requirement for the new tier was to eliminate any unnecessary metadata overhead for photo read operations, so that each read I/O operation was only reading actual photo data (instead of filesystem metadata). Haystack can be broken down into these functional layers:

  • HTTP server
  • Photo Store
  • Haystack Object Store
  • Filesystem
  • Storage

In the following sections we look closely at each of the functional layers from the bottom up.

Storage

Haystack is deployed on top of commodity storage blades. The typical hardware configuration of a 2U storage blade is:

  • 2 x quad-core CPUs
  • 16GB – 32GB memory
  • hardware raid controller with 256MB – 512MB of NVRAM cache
  • 12+ 1TB SATA drives

Each storage blade provides around 10TB of usable space, configured as a RAID-6 partition managed by the hardware RAID controller. RAID-6 provides adequate redundancy and excellent read performance while keeping the storage cost down. The poor write performance is partially mitigated by the RAID controller NVRAM write-back cache. Since the reads are mostly random, the NVRAM cache is fully reserved for writes. The disk caches are disabled in order to guarantee data consistency in the event of a crash or a power loss.

Filesystem

Haystack object stores are implemented on top of files stored in a single filesystem created on top of the 10TB volume. Photo read requests result in read() system calls at known offsets in these files, but in order to execute the reads, the filesystem must first locate the data on the actual physical volume. Each file in the filesystem is represented by a structure called an inode which contains a block map that maps the logical file offset to the physical block offset on the physical volume. For large files, the block map can be quite large depending on the type of the filesystem in use. Block based filesystems maintain mappings for each logical block, and for large files, this information will not typically fit into the cached inode and is stored in indirect address blocks instead, which must be traversed in order to read the data for a file. There can be several layers of indirection, so a single read could result in several I/Os depending on whether or not the indirect address blocks are cached. Extent based filesystems maintain mappings only for contiguous ranges of blocks (extents). A block map for a contiguous large file could consist of only one extent which would fit in the inode itself. However, if the file is severely fragmented and its blocks are not contiguous on the underlying volume, its block map can grow large as well. With extent based filesystems, fragmentation can be mitigated by aggressively allocating a large chunk of space whenever growing the physical file. Currently, the filesystem of choice is XFS, an extent based filesystem providing efficient file preallocation.

Haystack Object Store

Haystack is a simple log structured (append-only) object store containing needles representing the stored objects. A Haystack consists of two files – the actual haystack store file containing the needles, plus an index file. The following figure shows the layout of the haystack store file:

My notes:

  1. a haystack consists of two files - the actual haystack store file containing the needles, plus an index file
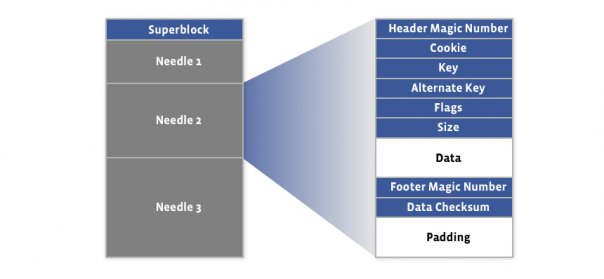
The first 8KB of the haystack store is occupied by the superblock. Immediately following the superblock are needles, with each needle consisting of a header, the data, and a footer:
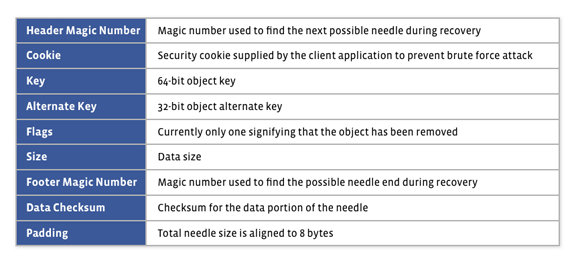
A needle is uniquely identified by its <Offset, Key, Alternate Key, Cookie> tuple, where the offset is the needle offset in the haystack store. Haystack doesn’t put any restriction on the values of the keys, and there can be needles with duplicate keys. Following figure shows the layout of the index file:
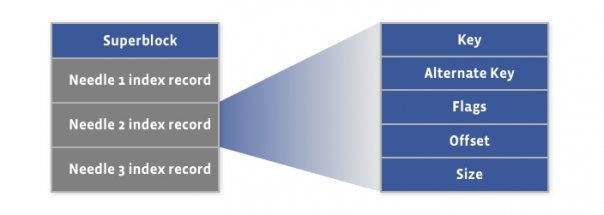
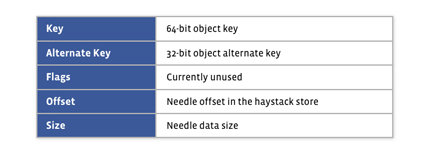
There is a corresponding index record for each needle in the haystack store file, and the order of the needle index records must match the order of the associated needles in the haystack store file. The index file provides the minimal metadata required to locate a particular needle in the haystack store file. Loading and organizing index records into a data structure for efficient lookup is the responsibility of the Haystack application (Photo Store in our case). The index file is not critical, as it can be rebuilt from the haystack store file if required. The main purpose of the index is to allow quick loading of the needle metadata into memory without traversing the larger Haystack store file, since the index is usually less than 1% the size of the store file.

Haystack Write Operation

A Haystack write operation synchronously appends new needles to the haystack store file. After the needles are committed to the larger Haystack store file, the corresponding index records are then written to the index file. Since the index file is not critical, the index records are written asynchronously for faster performance. The index file is also periodically flushed to the underlying storage to limit the extent of the recovery operations caused by hardware failures. In the case of a crash or a sudden power loss, the haystack recovery process discards any partial needles in the store and truncates the haystack store file to the last valid needle. Next, it writes missing index records for any trailing orphan needles at the end of the haystack store file. Haystack doesn’t allow overwrite of an existing needle offset, so if a needle’s data needs to be modified, a new version of it must be written using the same <Key, Alternate Key, Cookie> tuple. Applications can then assume that among the needles with duplicate keys, the one with the largest offset is the most recent one.

Haystack Read Operation

The parameters passed to the haystack read operation include the needle offset, key, alternate key, cookie and the data size. Haystack then adds the header and footer lengths to the data size and reads the whole needle from the file. The read operation succeeds only if the key, alternate key and cookie match the ones passed as arguments, if the data passes checksum validation, and if the needle has not been previously deleted (see below).

Haystack Delete Operation

The delete operation is simple – it marks the needle in the haystack store as deleted by setting a “deleted” bit in the flags field of the needle. However, the associated index record is not modified in any way so an application could end up referencing a deleted needle. A read operation for such a needle will see the “deleted” flag and fail the operation with an appropriate error. The space of a deleted needle is not reclaimed in any way. The only way to reclaim space from deleted needles is to compact the haystack (see below).

Photo Store Server

Photo Store Server is responsible for accepting HTTP requests and translating them to the corresponding Haystack store operations. In order to minimize the number of I/Os required to retrieve photos, the server keeps an in-memory index of all photo offsets in the haystack store file. At startup, the server reads the haystack index file and populates the in-memory index. With hundreds of millions of photos per node (and the number will only grow with larger capacity drives), we need to make sure that the index will fit into the available memory. This is achieved by keeping a minimal amount of metadata in memory, just the information required to locate the images. When a user uploads a photo, it is assigned a unique 64-bit id. The photo is then scaled down to 4 different sizes. Each scaled image has the same random cookie and 64-bit key, and the logical image size (large, medium, small, thumbnail) is stored in the alternate key. The upload server then calls the photo store server to store all four images in the Haystack. The in-memory index keeps the following information for each photo:Haystack uses the open source Google sparse hash data structure to keep the in-memory index small, since it only has 2 bits of overhead per entry.
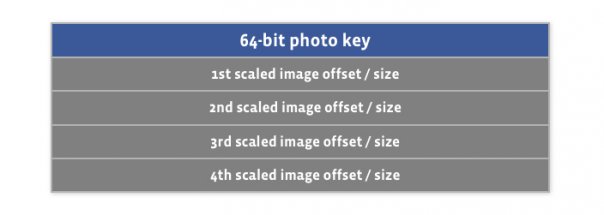
Photo Store Write/Modify Operation

A write operation writes photos to the haystack and updates the in-memory index with the new entries. If the index already contains records with the same keys then this is a modification of existing photos and only the index records offsets are modified to reflect the location of the new images in the haystack store file. Photo store always assumes that if there are duplicate images (images with the same key) it is the one stored at a larger offset which is valid.

Photo Store Read Operation

The parameters passed to a read operation include haystack id and a photo key, size and cookie. The server performs a lookup in the in-memory index based on the photo key and retrieves the offset of the needle containing the requested image. If found it calls the haystack read operation to get the image. As noted above haystack delete operation doesn’t update the haystack index file record. Therefore a freshly populated in-memory index can contain stale entries for the previously deleted photos. Read of a previously deleted photo will fail and the in-memory index is updated to reflect that by setting the offset of the particular image to zero.

Photo Store Delete Operation

After calling the haystack delete operation the in-memory index is updated by setting the image offset to zero signifying that the particular image has been deleted.

Compaction

Compaction is an online operation which reclaims the space used by the deleted and duplicate needles (needles with the same key). It creates a new haystack by copying needles while skipping any duplicate or deleted entries. Once done it swaps the files and in-memory structures.

HTTP Server

The HTTP framework we use is the simple evhttp server provided with the open source libevent library. We use multiple threads, with each thread being able to serve a single HTTP request at a time. Because our workload is mostly I/O bound, the performance of the HTTP server is not critical.

Summary

Haystack presents a generic HTTP-based object store containing needles that map to stored opaque objects. Storing photos as needles in the haystack eliminates the metadata overhead by aggregating hundreds of thousands of images in a single haystack store file. This keeps the metadata overhead very small and allows us to store each needle’s location in the store file in an in-memory index. This allows retrieval of an image’s data in a minimal number of I/O operations, eliminating all unnecessary metadata overhead.

Peter Vajgel, Doug Beaver and Jason Sobel are infrastructure engineers at Facebook.

Crude oil price: Go up to $100 from $80 per barrel

 美国银行在最新研报中称,如果今年冬季寒冷,而且随着全球航空公司为美国重新开放边境做准备,全球能源危机可能有助于推动油价自2014年以来首次突破每桶100美元后会引发全球经济危机,柴油价格则可能会突破每桶120美元。并给出了3点原因:

  1. 天然气价格飙升令人们转向原油作为取暖燃料,从天然气转到原油的替代量可能达到100万至200万桶/日。

  2. 冬季寒冷可能对原油需求构成50万桶/日的提振。

  3. 航空交通的增加可能在2022年第一季度增加油需30万至50万桶/日。


与美国银行一样,鼓吹“超级周期即将到来”的大宗商品旗手高盛也高调看好油价涨势。称结构性需求将取代周期性因素支撑油价继续走高,布伦特原油自2018年10月以来首次涨破80美元之后,这种涨势会继续下去,预计今年年底布油升至90美元/桶。


在原油库存方面,高盛表示在疫情期间积累的高原油库存正以450万桶/天的创纪录速度快速消耗。相关的消耗量已经超过OPEC+短期内能够增产的能力,而美国页岩油的复产还在初始阶段。这为全球原油库存在年底前降至2013年以来的最低水平奠定了基础。


产能不足则会加剧油价飙升。美国页岩气田最大的运营商——先锋自然资源公司的首席执行官Scott Sheffield表示:美国原油生产商无法增加供应,以遏制仍在“OPEC+控制下”的原油价格飙升。


维托尔亚洲主管Mike Muller表示。在美国,“如果你需要额外的原油,那么钻机数量根本无法满足产量的需求。”


周末,美国南加州外海海底的油管发生了漏油事件。Amplify Energy昨天暴跌44%,该公司管道破裂导致12.6万加仑的原油泄漏到海洋中。


More details about the October 4 outage | 20 minutes reading time

 POSTED ON  TO NETWORKING & TRAFFIC

By 

Now that our platforms are up and running as usual after yesterday’s outage, I thought it would be worth sharing a little more detail on what happened and why — and most importantly, how we’re learning from it. 

This outage was triggered by the system that manages our global backbone network capacity. The backbone is the network Facebook has built to connect all our computing facilities together, which consists of tens of thousands of miles of fiber-optic cables crossing the globe and linking all our data centers.

Those data centers come in different forms. Some are massive buildings that house millions of machines that store data and run the heavy computational loads that keep our platforms running, and others are smaller facilities that connect our backbone network to the broader internet and the people using our platforms. 

When you open one of our apps and load up your feed or messages, the app’s request for data travels from your device to the nearest facility, which then communicates directly over our backbone network to a larger data center. That’s where the information needed by your app gets retrieved and processed, and sent back over the network to your phone.

The data traffic between all these computing facilities is managed by routers, which figure out where to send all the incoming and outgoing data. And in the extensive day-to-day work of maintaining this infrastructure, our engineers often need to take part of the backbone offline for maintenance — perhaps repairing a fiber line, adding more capacity, or updating the software on the router itself.

This was the source of yesterday’s outage. During one of these routine maintenance jobs, a command was issued with the intention to assess the availability of global backbone capacity, which unintentionally took down all the connections in our backbone network, effectively disconnecting Facebook data centers globally. Our systems are designed to audit commands like these to prevent mistakes like this, but a bug in that audit tool prevented it from properly stopping the command. 

This change caused a complete disconnection of our server connections between our data centers and the internet. And that total loss of connection caused a second issue that made things worse.  

One of the jobs performed by our smaller facilities is to respond to DNS queries. DNS is the address book of the internet, enabling the simple web names we type into browsers to be translated into specific server IP addresses. Those translation queries are answered by our authoritative name servers that occupy well known IP addresses themselves, which in turn are advertised to the rest of the internet via another protocol called the border gateway protocol (BGP). 

To ensure reliable operation, our DNS servers disable those BGP advertisements if they themselves can not speak to our data centers, since this is an indication of an unhealthy network connection. In the recent outage the entire backbone was removed from operation,  making these locations declare themselves unhealthy and withdraw those BGP advertisements. The end result was that our DNS servers became unreachable even though they were still operational. This made it impossible for the rest of the internet to find our servers. 

All of this happened very fast. And as our engineers worked to figure out what was happening and why, they faced two large obstacles: first, it was not possible to access our data centers through our normal means because their networks were down, and second, the total loss of DNS broke many of the internal tools we’d normally use to investigate and resolve outages like this. 

Our primary and out-of-band network access was down, so we sent engineers onsite to the data centers to have them debug the issue and restart the systems. But this took time, because these facilities are designed with high levels of physical and system security in mind. They’re hard to get into, and once you’re inside, the hardware and routers are designed to be difficult to modify even when you have physical access to them. So it took extra time to activate the secure access protocols needed to get people onsite and able to work on the servers. Only then could we confirm the issue and bring our backbone back online. 

Once our backbone network connectivity was restored across our data center regions, everything came back up with it. But the problem was not over — we knew that flipping our services back on all at once could potentially cause a new round of crashes due to a surge in traffic. Individual data centers were reporting dips in power usage in the range of tens of megawatts, and suddenly reversing such a dip in power consumption could put everything from electrical systems to caches at risk.   

Helpfully, this is an event we’re well prepared for thanks to the “storm” drills we’ve been running for a long time now. In a storm exercise, we simulate a major system failure by taking a service, data center, or entire region offline, stress testing all the infrastructure and software involved. Experience from these drills gave us the confidence and experience to bring things back online and carefully manage the increasing loads. In the end, our services came back up relatively quickly without any further systemwide failures. And while we’ve never previously run a storm that simulated our global backbone being taken offline, we’ll certainly be looking for ways to simulate events like this moving forward.  

Every failure like this is an opportunity to learn and get better, and there’s plenty for us to learn from this one. After every issue, small and large, we do an extensive review process to understand how we can make our systems more resilient. That process is already underway.  

We’ve done extensive work hardening our systems to prevent unauthorized access, and it was interesting to see how that hardening slowed us down as we tried to recover from an outage caused not by malicious activity, but an error of our own making. I believe a tradeoff like this is worth it — greatly increased day-to-day security vs. a slower recovery from a hopefully rare event like this. From here on out, our job is to strengthen our testing, drills, and overall resilience to make sure events like this happen as rarely as possible.


The Storage Technologies Behind Facebook Messages

Oct. 5, 2021

Here is the link. 


Consistency Models | HBase definitive guide book reading

Oct. 5, 2021

I like to take some notes:

Consistency models:

  1. Strict
  2. Sequential
  3. Causal
  4. Eventual
  5. Weak

Consistency Models

It seems fitting to talk about consistency a bit more since it is mentioned often throughout this book. On the outset, consistency is about guaranteeing that a database always appears truthful to its clients. Every operation on the database must carry its state from one consistent state to the next. How this is achieved or implemented is not specified explicitly so that a system has multiple choices. In the end, it has to get to the next consistent state, or return to the previous consistent state, to fulfill its obligation.

Consistency can be classified in, for example, decreasing order of its properties, or guarantees offered to clients. Here is an informal list:

Strict

The changes to the data are atomic and appear to take effect instantaneously. This is the highest form of consistency.

Sequential

Every client sees all changes in the same order they were applied.

Causal

All changes that are causally related are observed in the same order by all clients.

Eventual

When no updates occur for a period of time, eventually all updates will propagate through the system and all replicas will be consistent.

Weak

No guarantee is made that all updates will propagate and changes may appear out of order to various clients.

The class of system adhering to eventual consistency can be even further divided into subtler sets, where those sets can also coexist. Werner Vogels, CTO of Amazon, lists them in his post titled “Eventually Consistent”. The article also picks up on the topic of the CAP theorem,* which states that a distributed system can only achieve two out of the following three properties: consistency, availability, and partition tolerance. The CAP theorem is a highly discussed topic, and is certainly not the only way to classify, but it does point out that distributed systems are not easy to develop given certain requirements. Vogels, for example, mentions: An important observation is that in larger distributed scale systems, network  partitions are a given and as such consistency and availability cannot be achieved at the same time. This means that one has two choices on what to drop; relaxing consistency will allow the system to remain highly available [...] and prioritizing consistency means that under certain conditions the system will not be available.

Relaxing consistency, while at the same time gaining availability, is a powerful proposition. However, it can force handling inconsistencies into the application layer and may increase complexity.

Medicine Ball Arm Workout | DietHealth

Oct. 5, 2021

Here is the link. 

With a 4- to 8-pound medicine ball, try this progressive arm workout. It starts off easy, but Lisa Johnson will show you how to steadily increase the difficulty. Your arms will be feeling this!! http://www.diet.com/videos/play/medic... Check out more from Lisa Johnson: http://www.lisajohnsonfitness.com Subscribe to our YouTube channel http://www.youtube.com/subscription_c... Tweet us http://www.twitter.com/DietHealth Facebook http://www.facebook.com/Dietcom Pinterest http://www.pinterest.com/Dietcom Sign up for our Free Weekly Newsletter! http://bit.ly/Diet-Newsletter Join Diet.com for free: http://bit.ly/JoinDiet Browse Sample Meal and Exercise Plans: http://www.diet.com/diet-plan/

Monday, October 4, 2021

Case study: GTE, RIG, BORR stocks | GTE stock Aug 19 0.45/ share -> Oct. 5, 0.94/ share, 100% gain

 Oct. 4, 2021


My purchase and sold detail 


Aug. 19, 2021 | GTE my position with over 30% loss | Purchased $15,000 RIG stock instead

Aug. 19 to Oct. 5, 100% return 


I have knowledge of GTE stock and analysis of capital market value learned from my research, what I need to work on is to have confidence, and learn how to hold on those positions. 


Lara Morgan: If you can learn to sell, you will make a profit | London Business School

Oct. 4, 2021

Here is the link. 

Lara Morgan is most widely known for building her own international business, Pacific Direct, over the course of seventeen years, before selling a majority share 99% holding of the company for £20 million. She is proud mother of three, and determined to be a voice for growth enterprise support as well as driving sales pride in Britain. Her talk at London Business School is part of the 2013-2014 Tell Series talks and it was recorded on Wednesday, 2 October 2013 at London Business School.

London Business School students created the TELL Series in 2009 to put the spotlight on entrepreneurship in Europe. The TELL Series showcases successful entrepreneurs' personal stories of building high growth businesses. Successful founders, investors and key figures from the European entrepreneurship world share their start-up stories, lessons learned and thoughts on the future. Tell Series is sponsored by the Deloitte Institute of Innovation and Entrepreneurship and Frog Capital. -- Learn more about entrepreneurial opportunities at the School: http://bit.ly/LBS-entrepreneur Learn more about Tell Series: http://tellseries.com/ Learn more about DIIE: http://innovation.london.edu/ Subscribe to more LBS videos: http://bit.ly/lbsyoutube

Opening Address by the Dean, Professor Sir Andrew Likierman

Oct. 4, 2021

Here is the link. 


London Business School: The challenge of making it happen l London Business School

Oct. 4, 2021

Here is the link. 

Over the last few decades we have learned a great deal about strategy, but much less about putting it into practice. And yet strategy execution is consistently cited as the major bugbear for senior executives. Dominic Houlder, Adjunct Professor of Strategy and Entrepreneurship, dismantles some of the myths surrounding effective strategy execution. The session draws on the School’s recently redesigned Executive Education programme, Executing Strategy for Results, which Dominic leads.

Find out more about the programme: http://bit.ly/2e1faTf Subscribe on YouTube: http://bit.ly/lbsyoutube Follow on Twitter: http://twitter.com/lbs

T stock: Purchase stocks before Oct. 7, 2021 | $0.52/ share dividend | Will be paid in Nov. 1, 2021

 Some investors rely on dividends for growing their wealth, and if you're one of those dividend sleuths, you might be intrigued to know that AT&T Inc. (NYSE:T) is about to go ex-dividend in just four days. The ex-dividend date is one business day before the record date, which is the cut-off date for shareholders to be present on the company's books to be eligible for a dividend payment. It is important to be aware of the ex-dividend date because any trade on the stock needs to have been settled on or before the record date. Meaning, you will need to purchase AT&T's shares before the 7th of October to receive the dividend, which will be paid on the 1st of November.

The company's next dividend payment will be US$0.52 per share. Last year, in total, the company distributed US$2.08 to shareholders. Based on the last year's worth of payments, AT&T stock has a trailing yield of around 7.7% on the current share price of $27.16. Dividends are a major contributor to investment returns for long term holders, but only if the dividend continues to be paid. As a result, readers should always check whether AT&T has been able to grow its dividends, or if the dividend might be cut.