Here is the article.
On Balance Volume
It’s easy enough to identify price jumps and plunges on heavy volume.
All you have to do is look for a quick price change and a spike in volume.
But how do you know if the volume is a lot relative to recent history?
That’s where On Balance Volume (OBV) becomes immensely helpful.
OBV starts with a baseline. It then adds volume when the candlestick closes positive and subtracts volume when the candlestick closes down.
That might not sound all that useful. But let’s look at an example using gold futures. The blue line at the bottom represents OBV.
This chart shows the price of gold futures drop and keep moving lower.
Similarly, the OBV drops. However, it doesn’t keep sliding lower the way price does. It’s far more stable.
If you look at the spot noted by the arrows, you’ll see that while Gold Futures are making substantially lower prices, OBV is only a touch lower.
Essentially, it’s telling us that the price of gold is moving lower on waning volume and actually precedes the price reversal.
Day traders use OBV to look for divergences to give them clues about when the market might be due for a reversal.
They’ll also look at it for confirmation of a trend when both price and the OBV are moving in the same direction.
Accumulation Distribution (A/D)
Similar to OBV, the Accumulation Distribution (A/D) indicator tries to represent volume that’s either being accumulated (bought) or distributed (sold).
The difference is in how the two are calculated.
OBV simply looks at whether the close of one period is above or below the prior period’s close, adding or subtracting the volume accordingly.
The A/D indicator does the same thing except adding volume when it closes in the upper half of the day’s range and subtracting it when it closes in the lower half.
While these indicators often provide similar signals, they will diverge, especially when there are gaps in price.
Just like the OBV, day traders will use the A/D indicator to look for divergences and trend confirmations.
The gold futures chart below highlights a clean example when price diverges from the A/D indicator.
In this example, gold futures drop rather severely. Yet, the A/D line barely budges, and in fact moves higher.
This is a bullish divergence, where traders may buy gold assuming the overall trend is intact and the A/D line’s divergence signals traders are actually buying the dip.
Chaikin Money Flow
Last on our list is the Chaikin Money Flow (CMF).
Like OBV and A/D, CMF measures volume buying and selling over time.
However, while the A/D is a cumulative metric, CMF normalizes the volume by comparing the Money Flow Volume (which adjusts the day’s volume based on the close’s position within the high-low range) to the total volume over a given time, usually 20 or 21 periods.
This normalization process makes the CMF less sensitive to one-day volume spikes and better at discerning price reversals and trends that are more sustainable.
The CMF is measured on a range from -1 to +1 or -100 to +100 with a zero line drawn down the middle.
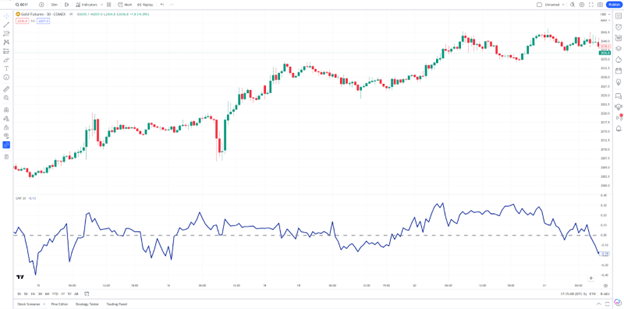
Let’s take a look at the gold futures below, with the CMF at the bottom.
In this chart, persistent CMF readings over the zero line indicate buying pressure.
If the CMF were to spend as much time under the zero line as over it, we’d have no real conviction one way or the other based on volume.
You can also use the CMF to spot divergences since money flow and price movement should be correlated.
So, if a stock rallies while the CMF remains below the zero line, it may indicate an opportunity to fade the move and short the market.
No comments:
Post a Comment