Click to Enlarge
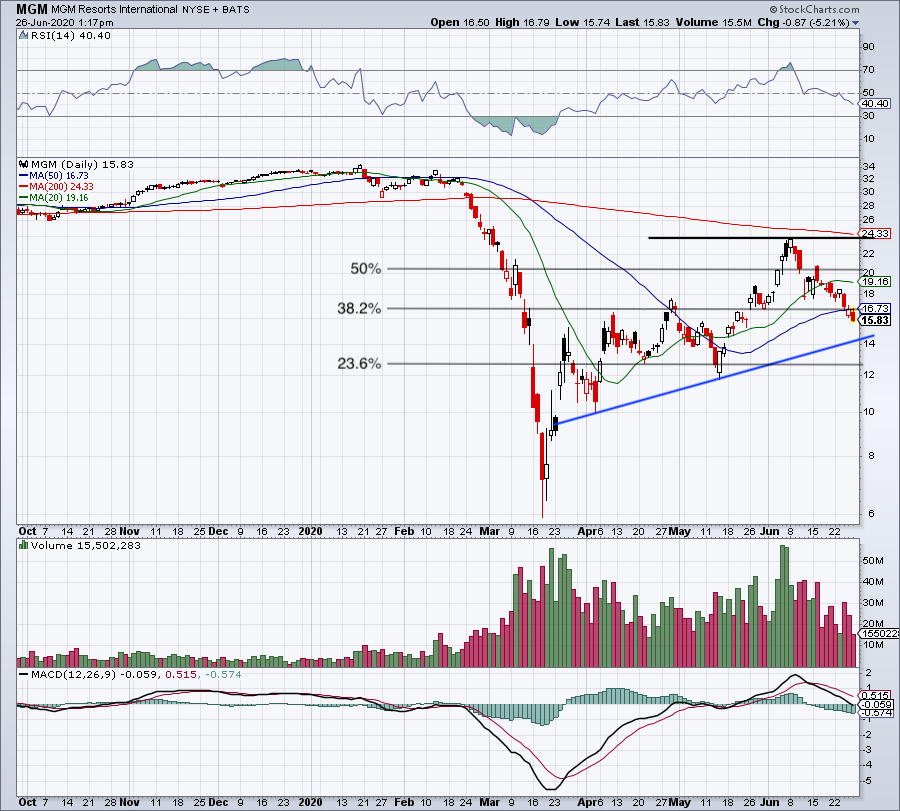
Source: Chart courtesy of StockCharts.com
June 30, 2020
The first thing I did when I wanted to get a look at MGM stock, was look at the charts. The second thing I did was size up the balance sheet. In regards to the latter, MGM seems fine.
Current assets of $7.6 billion easily outweigh current liabilities of $2.6 billion. From that perspective, liquidity isn’t an issue for me. While cutting the dividend and working on netting out its free cash outflow, an increase in revenue should help keep the financials afloat.
As for the stock price though, it’s starting to struggle. Momentum is waning, as MGM stock breaks below the 38.2% retracement and the 50-day moving average. A correction from $24 down to the 50-day moving average just under $17 should have been a good buying opportunity. But it’s failing to hold, showing that bulls don’t have control — demand is not strong enough.
Below the 50-day moving average and investors will have to see how uptrend support (blue line) holds up. I don’t like putting all my eggs in that basket though, particularly as other more significant support levels failed.
On the upside, let’s see if MGM stock can reclaim the 50-day moving average, putting $19 to $20 back in play.
From the article.
No comments:
Post a Comment