Mark Minervini Strategy | Think and Trade Like a Champion Part 2 | Trading Strategy
By Kristoff De Turck - reviewed by Aldwin Keppens
Last update: Jul 22, 2024
Here is the article.
Trading is a Business, the Importance of Risk Management
Losses are inevitable
Mark Minervini spends the last two chapters of his book "Trade Like a Stock Market Wizard" entirely on risk management and there is a good reason for doing so. No matter what strategy you use or how successful it is, if you don't control your risk you will fail sooner or later anyway.
With every new position you take, you must start with the question "What am I risking and what am I going to do to protect my capital to the maximum if things go wrong?". This is the only way to survive in the long run as a trader.
Avoiding big losers is key
Not all of your positions will be successful. Losses are inherently part of any strategy.
Loss positions, as such, are not a problem. Only how you deal with them can become a problem if you don't know how to control them.
There is only one important rule. Individual losses should always be kept small.
Five consecutive long positions where you get stopped out at your initial stop-loss are anything but fun, but it is not a tragedy if the individual loss per position is only 1% of your total trading account. After five losers you will be looking at a total loss of 5%.
However, if you took a 5% risk per position you will be looking at a loss of as much as 25% after those same five trades! Now that's a problem!
So focus on the size of your losers instead of constantly asking yourself how much you will earn with the winners.
You can start from a risk perspective in two ways:
Initial stop loss
Your initial stop loss is the most important order of all. It ensures that you draw a hard line to where you are willing to take risk. Once the price reaches that line, the position is irrevocably closed.
The size of the stop loss depends on your risk profile, but will normally range between 0.5 and 2.5%. For a first (test) position in a stock, it is best to start on the low side. When you notice that several initial positions quickly turn into profits and the probability of a new bull market increases, you can be more aggressive with your risk percentage.
A risk% of 0.5% on a trading account of $100,000 means that if your initial stop loss is hit, your loss should not exceed $500 (0.5% of $100,000).
If you use a risk percentage of 1.5%, your loss on that position will be $1,500.
A difference between 0.5% and 1.5% may not seem like much on paper but appearances can be deceptive... This becomes visible when you are confronted with a succession of loss positions. Suppose your initial stop loss is hit 6 times in a row:
6*0.5% = 3% loss on your total account
6*1.5% = 9% loss on your total account
That's a difference of a whopping 6% after just 6 trades!
Position Sizing
But it doesn't stop there. At least as important is the question "How many shares do I buy? Take a quick look at the setup below.
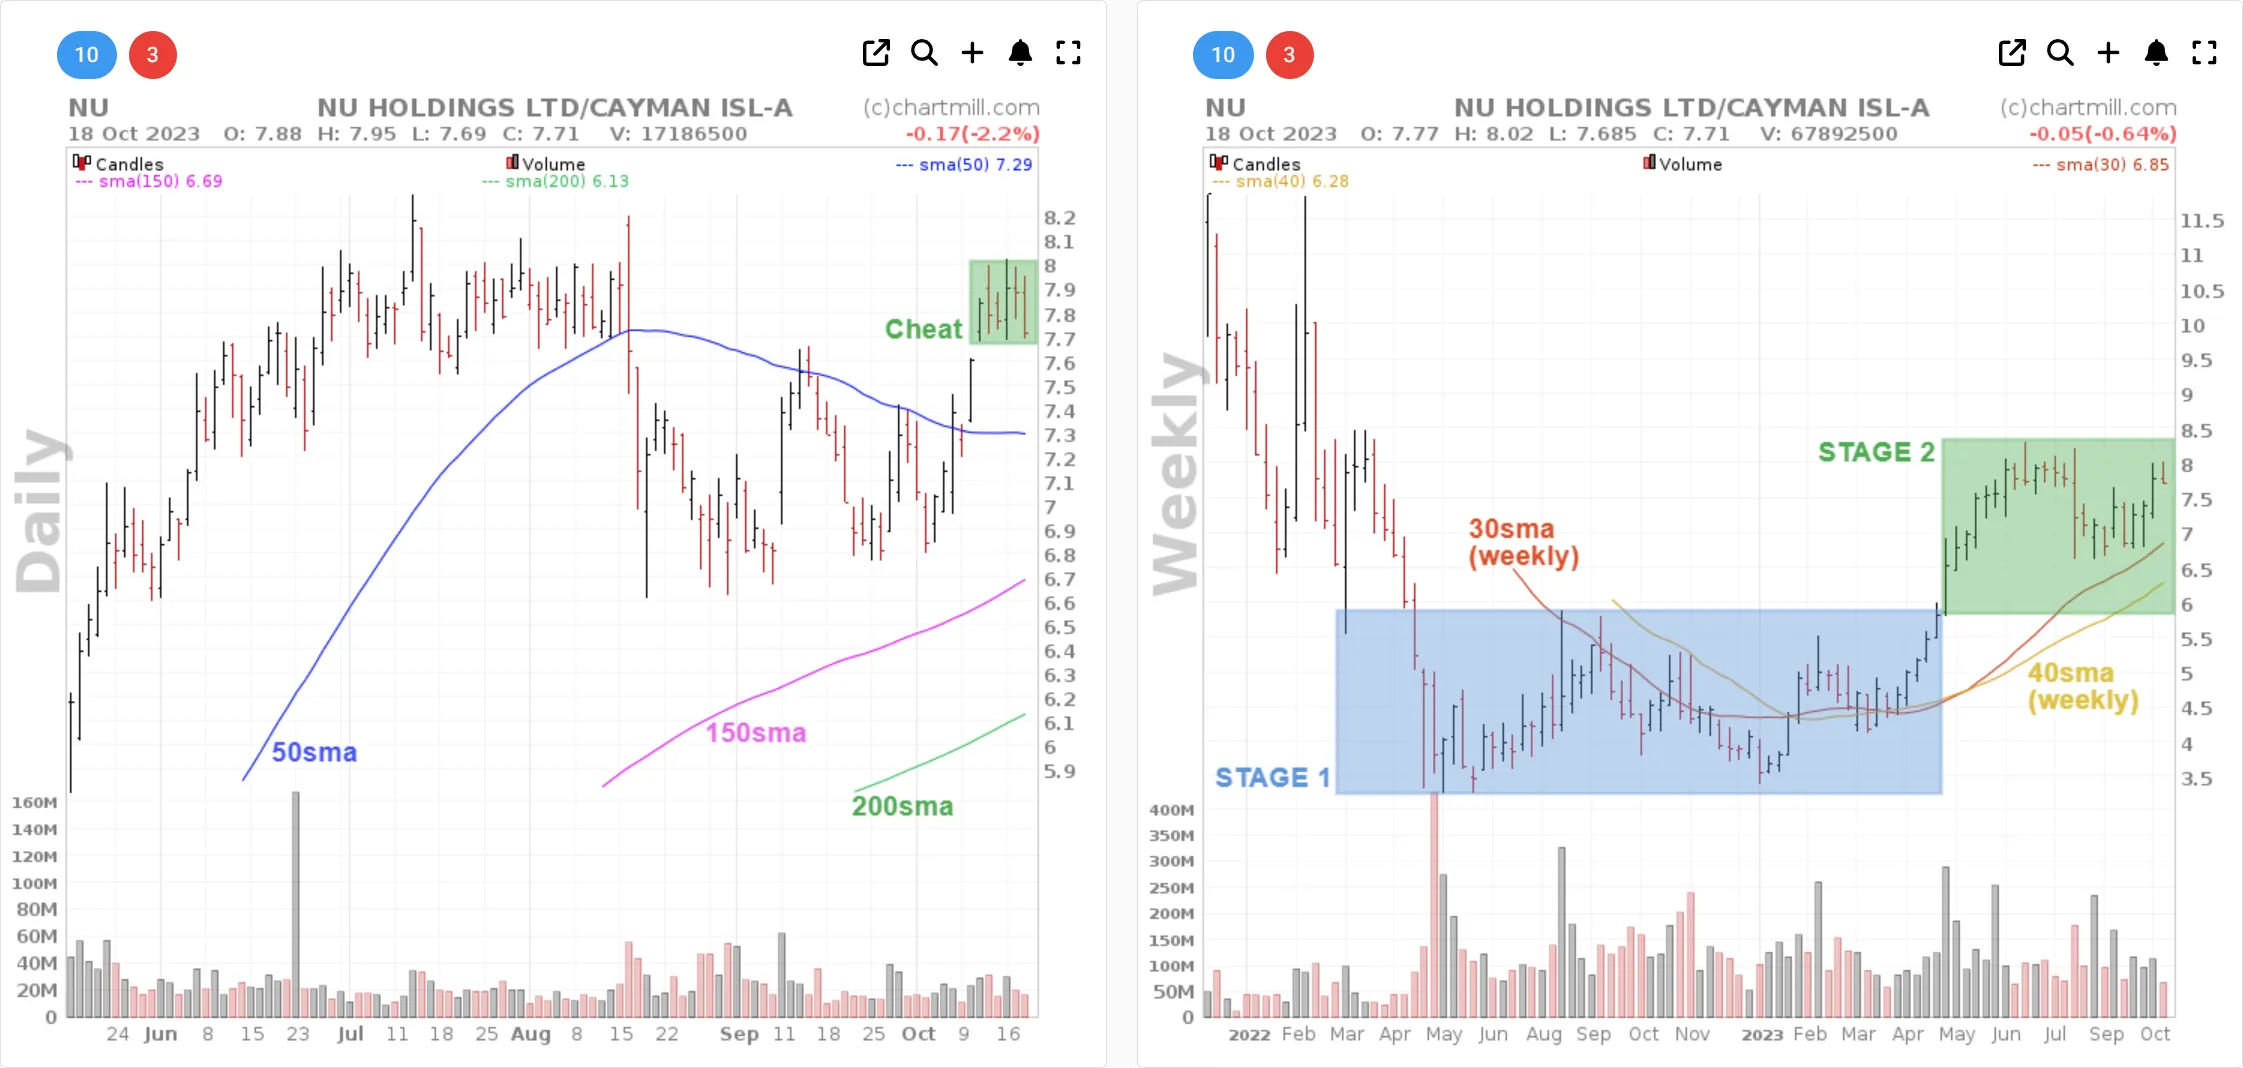
On the left is the daily chart, and on the right is the weekly chart of the ticker NU at the date of Oct. 18, 2023. This is a ticker that conforms to Mark Minervini's Trend Template. The fundamental criteria are not important for this particular example.
The weekly chart shows that the stock broke out of its stage 1 several months ago and is now forming a first base in its stage 2.
On the daily chart, we are looking at the formation of a 3C pattern (Cup Completion Cheat).
Suppose you want to go long as soon as the price moves above the cheat range. You set a stop market order at $8.03 with a limit of $8.08. The stop-loss is set at $7.67 (just below the cheat range). If the price hits your stop you want to risk a maximum of 2% of your total trading account (set at $100,000 in this example).
If we enter these parameters in our Stock Position Size Calculator we get the following data:
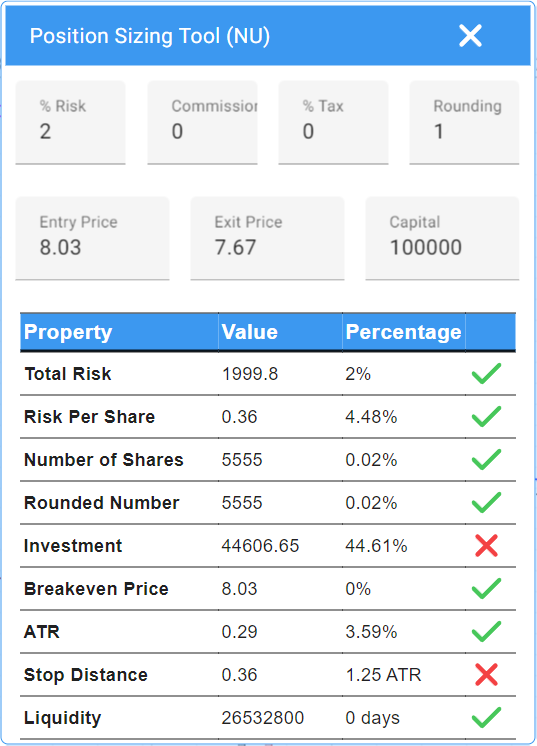
The risk is indeed limited to only $2,000 (2% of the total account size) but also consider the total amount invested. This setup requires a capital of over $44,000, which is about 44% of your entire trading account.
Now imagine that unexpected very bad news is announced about the company and the stock price opens 50% lower the next trading day.... This drops the total value of the investment from $44,606 to $22,303. That's an immediate loss on your total capital of more than 22%!
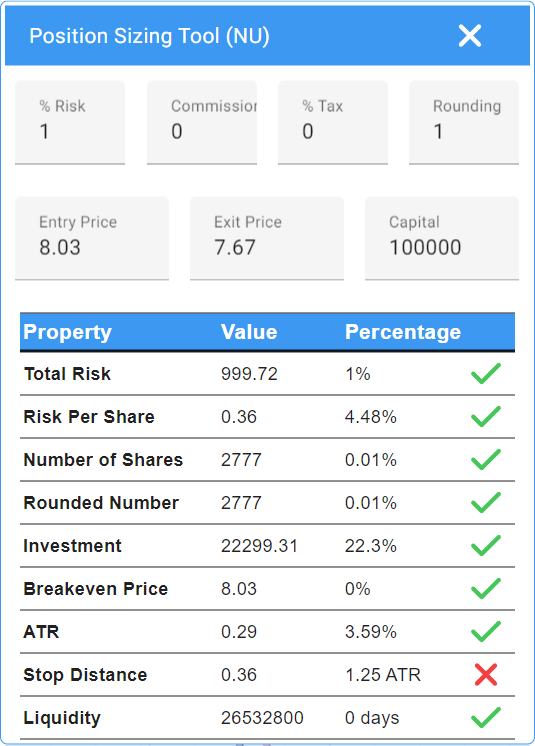
To avoid this, you can do two things:
Either lower the risk percentage to, say, 1%, in which case the investment lowers to $22,299. Or the stop loss can be placed further down ($7.38) lowering the total investment to $24,700.
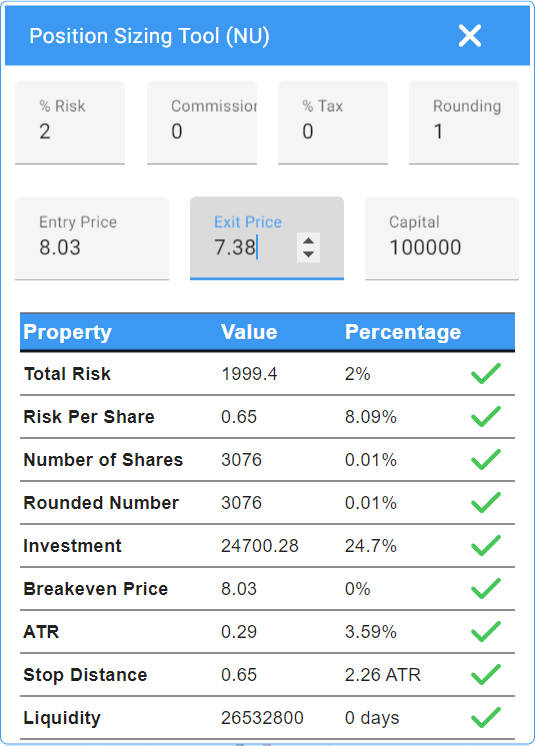
In case the stop loss is set lower you also notice that the ATR warning disappears (visible if the stop loss is placed at less than 2 times the average daily range). You can read more about the Average True Range inthe following article 'Average True Range (ATR) Volatility Indicator'
The Stock Position Size Calculator gives a warning as soon as the invested capital in a single position exceeds 25% or ¼ of the total available trading capital. To be clear, that is a maximum.
When carefully entering new setups after a long-term downtrend, it is advisable to start smaller and, for example, start with half a position. In doing so, your investment in one position is thus limited to 12.5%. If you notice that your vision is correct you can gradually increase your order size to a full position.
Taking profits
Eventually, there comes a time when you take profits from the table. This can be done in many different ways but realize that no one way will allow you to always sell your position at the highest price.
There will always be positions where you sold too soon and others where you would have been better off cashing in profits a little earlier. It is vital that you follow a number of rules that allow you to trade according to a fixed framework.
First, a distinction should be made between selling during price strength or price weakness.
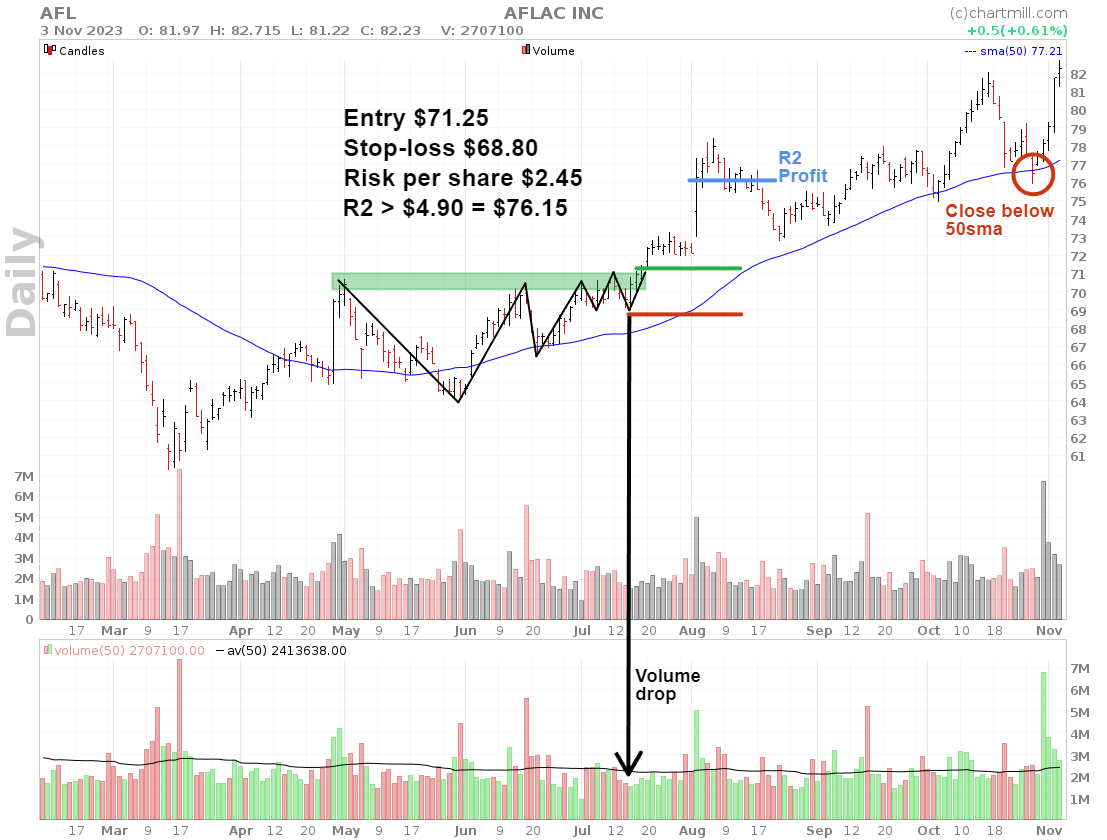
Selling during price weakness (when prices are falling)
Signs of price weakness after a rising trend include the size of the price drop and the volume involved.
For example, when the price shows the largest price decline since the beginning of the point at which you bought or (and) if the decline is accompanied by remarkably high volume, these are strong indications of weakness.
This is precisely what the stop loss is for. It will protect you if the price falls below the level at which you set your stop loss.
A fixed rule is that a position that shows a profit twice as high as the initial risk (a profit of 2R) should not turn into a loss. This is the so-called 'breakeven or better' rule. The stop is placed at breakeven from then on.
Whether you hold the entire position or sell half of it is personal. A useful guideline is - once the price has reached your breakeven price - to use the 50sma as a kind of trailing stop-loss.
As soon as the price closes below that average you sell (the rest of) the position or increase the stop loss to just below the low of that day. If the price opens or falls below the low the following day, the position is automatically sold.
Selling during price strength (when prices are rising)
Giving winners time and space to reach their full potential is one of the conditions for achieving exceptional results. The problem, however, is that you never know in advance how far the stock price will rise. A 100% price gain is impressive, but chances are you will find it much less impressive if it turns out after you have sold the stock, that the price has risen by many more hundreds of percent.
Selling into strength is therefore only advisable if you suspect a real "price extreme" situation. This occurs when the price has overshot so hard that it deviates to an extreme degree from the intrinsic value of the stock, even taking into account very optimistic prospects.
This increases the likelihood of a rapid and aggressive pullback. It pays to try to recognize such price extremes early on and anticipate them by securing profits.
First and foremost, the most important thing is to determine what upward phase the stock is in. A temporary price extreme resulting from an initial price breakout from stage 1 to stage 2 is not the time when you should sell during price strength. After all, the chances of this being a true Power Play are considerable.
However, the chart below shows a completely different situation:
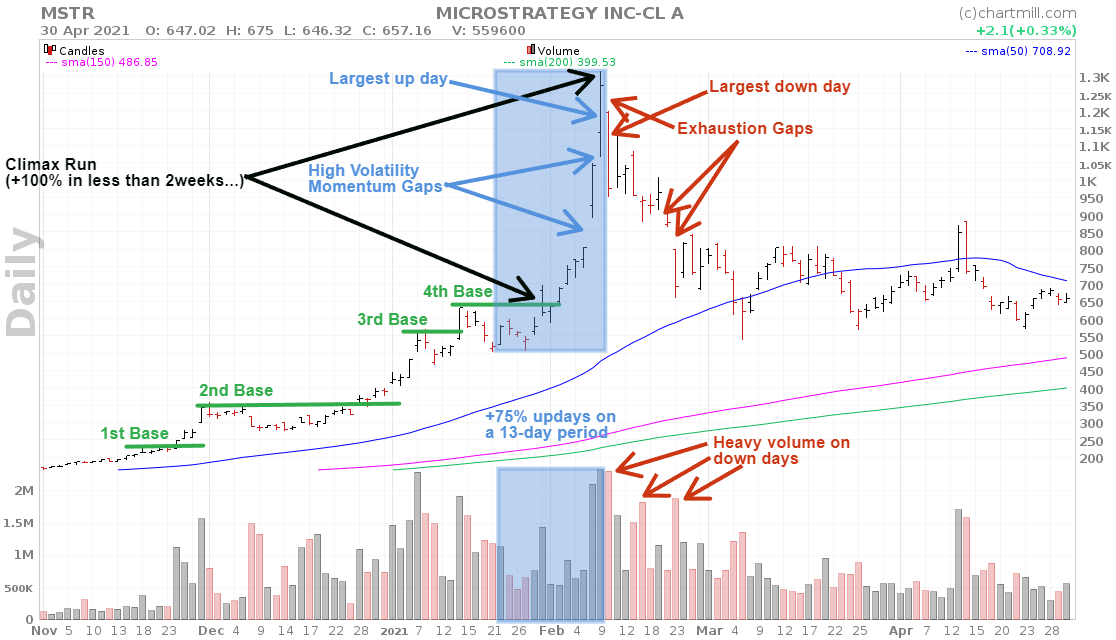
MSTR shares are showing a real climax run after forming a fourth consecutive base in the same stage 2. In less than two weeks, the stock rose by a whopping 100% (from $650 to $1300).
In the period from January 22, 2021 ,to February 09, 2021, (13 trading days), the stock experienced 10 up days and only three down days (+75% up days).
During this surge several high volatility momentum gaps are visible and there is a real buyers' frenzy.
The largest up day on February 09 (+22%) is immediately followed by the largest down day (-23%). Both days also show the highest volume.
The biggest down day opens lower than the previous day's close (gap down). During the decline that follows, further exhaustion gaps are visible.
The volume on the down days after the largest down day on January 10, is much higher than the volume during the intervening up days.
The book also cites the P/E ratio as a kind of indication of a price extreme. When this ratio has roughly doubled since the time you bought your initial position, due to the very strong price increase, that is an additional indication of a price extreme.
No two situations are identical and making this kind of analysis based on an already known price trend is very easy. But at least it makes you think when faced with a similar situation, where a stock that has already risen quite a bit suddenly shows signs of a price extreme with a typical climax run.
That doesn't necessarily mean you should sell in a rush but armed with this knowledge, maybe it's the perfect time to protect those quick and easy profits in large part by raising your stop-loss quite aggressively?
One option in this case could have been to at least raise the stop-loss from the penultimate trading day before the final top (Jan. 08) to just below that day's low.
The day after that, on January 09 (when the top was formed) you could have done the same thing (raise stop-loss again to just below that day's low) and you would have finally exited around $1065 on January 10.
Progressive Exposure
Progressive exposure involves scaling in and out of positions based on current market conditions. In favorable market conditions, exposure is increased by taking larger positions. More information can be found in this separate article "Mastering Market Dynamics: The Benefits of Progressive Exposure"
Final Considerations
Trading Journal
Mark Minervini is a big proponent of keeping a trading journal. It gives you insight into several key elements that ensure you maintain consistency in your trading.
A good trading journal doesn't have to be super detailed. It does need to answer the following questions:
- What is the average size of your losers and winners?
- How many of your trades do you close successfully?
- What is your largest loss and profit position?
- How does the size of your losers compare to your winners?
- On average, how long do you hold a position?
This data is invaluable because such data gives an insight into what results you can expect in the long run, based on the results you have already achieved before. It goes without saying that the more data you collect, the more reliable the results will be.
His book "Think and Trade Like a Champion" devotes an entire chapter to it.
Picking bottoms
Trying to predict tops and bottoms is the best way to see your capital evaporate at a rapid pace. Saying that a price bottom "will be reached by now" because the price has already fallen 80% (from $100 to $20) is nonsense. Few people seem to realize that if in the following days, weeks or months the price drops further from $20 to $5, that is another drop of 75%!
It is much easier AND more effective to focus on stocks that are already rising because that way you are trading in the direction of the existing price trend.
Diversification
Diversification across sectors and industries is seen as the holy grail to spread your risk as effectively as possible but it offers little to no protection in the event of an overall market decline.
This is because it makes little difference what type of stocks you own if stock market sentiment becomes truly negative. During a true bear market, all stocks plummet.
At best, specific sectors may fall slightly less but all stocks undergo the negative sentiment, including so-called "quality" stocks. These are the stocks of companies that have excelled for several consecutive years with solid earnings and impressive margins and also have a decent pile of cash to be well-armed against a temporary economic downturn.
With a long-term horizon, these are undoubtedly the best stocks to own, but as a trader, you are not so much focused on the very long term but mainly want to take advantage of momentum. That requires that you will sometimes be heavily invested in one or a few sectors because that is where the strongest performers are.
Managing your risk is done by paying attention to the size of your positions and the risk associated with each individual position according to your available trading capital.
No comments:
Post a Comment